EFFECTS OF FASTENERS
PRETENSION IN A CONTACT
ENABLED ANALYSIS
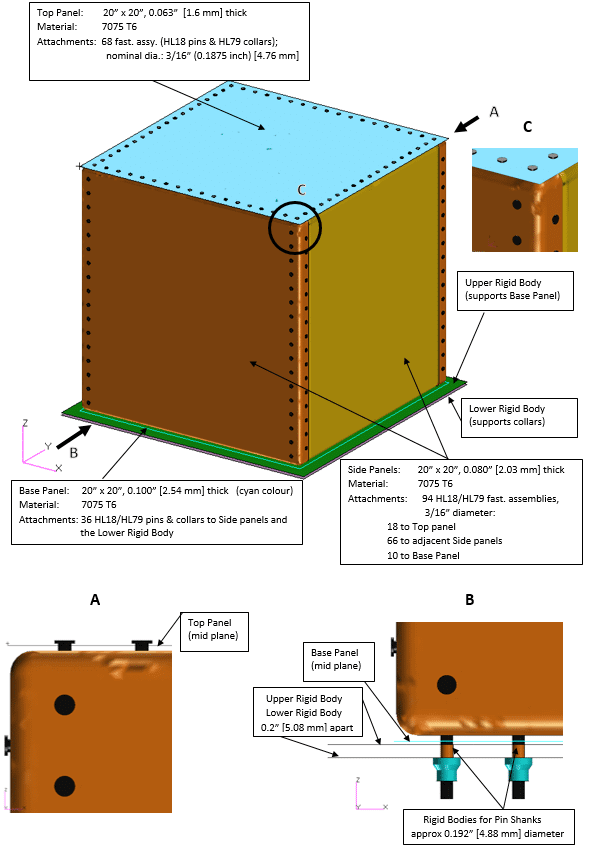
A 20″(508mm) cubic box, modelled with 2D shells, located at mid plane of the parts was used to assess the effect of fasteners pretension over a wide range of deformations and stress levels in the components. For this purpose, two models representing one quarter of the box were used.
The first model, representative of classical sizing practices, did not include details at the fastener holes—with the fasteners being idealised by short springs connecting the parts at the appropriate locations. In this representation, the initial fastener pretension was not accounted for because the end nodes of the spring elements belong to the panels.
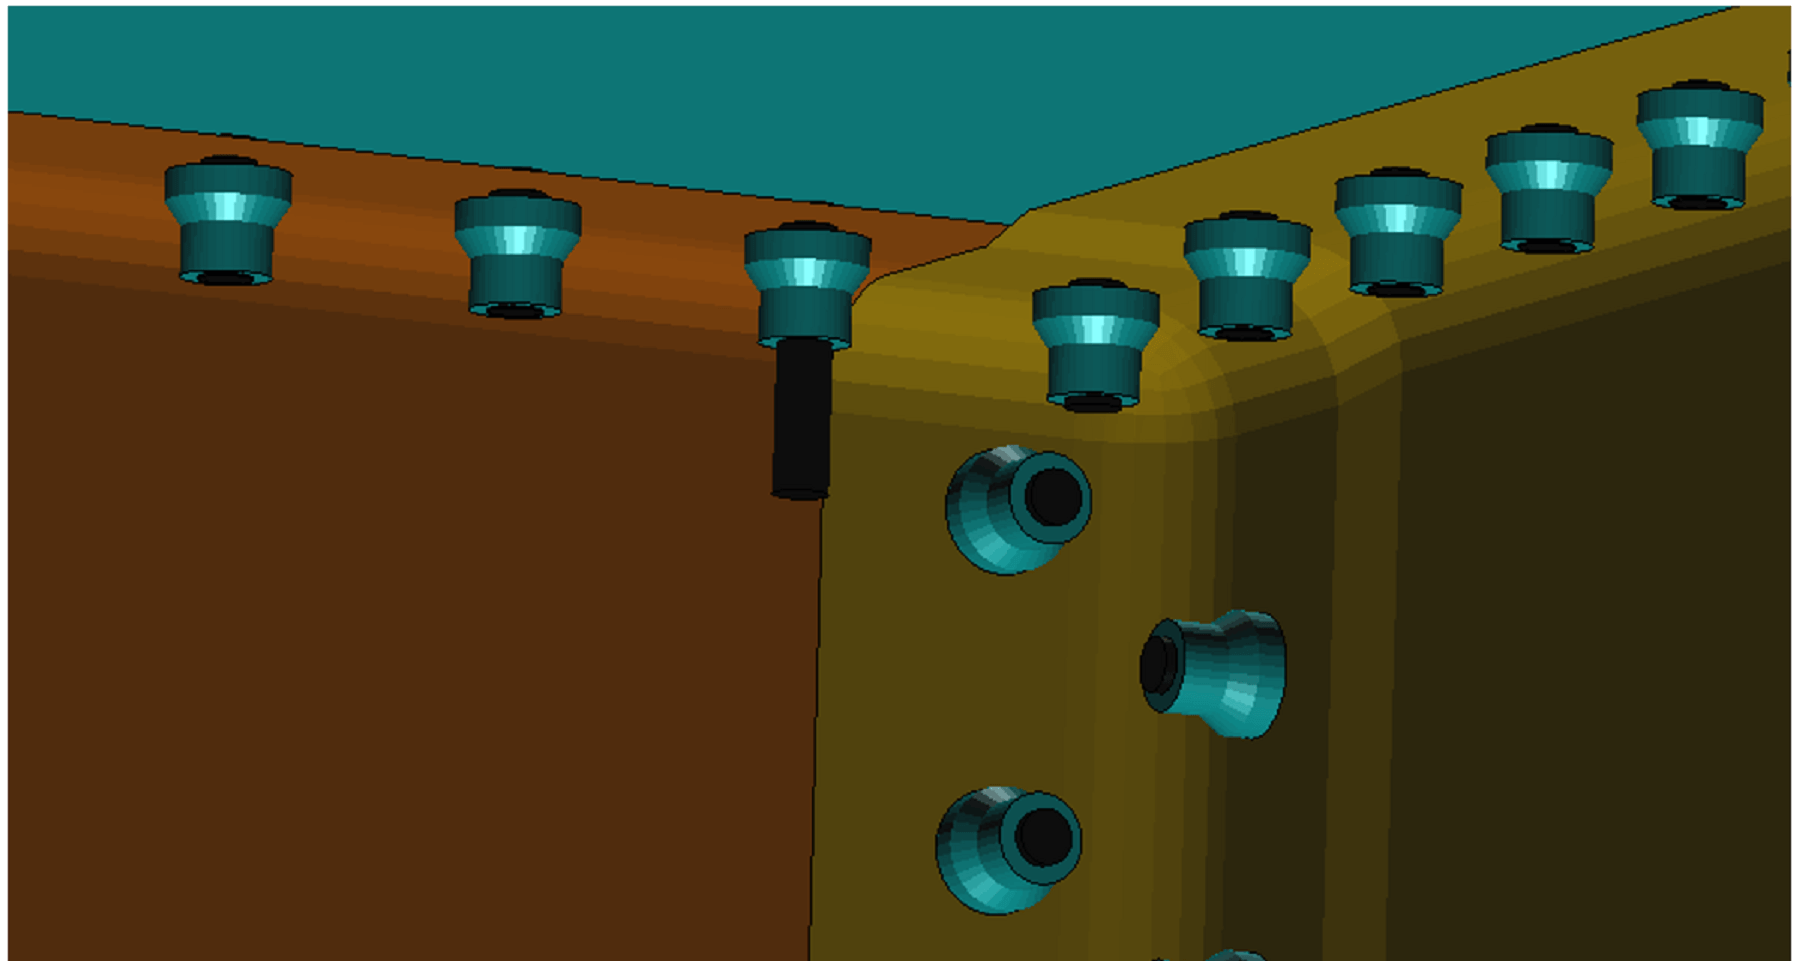
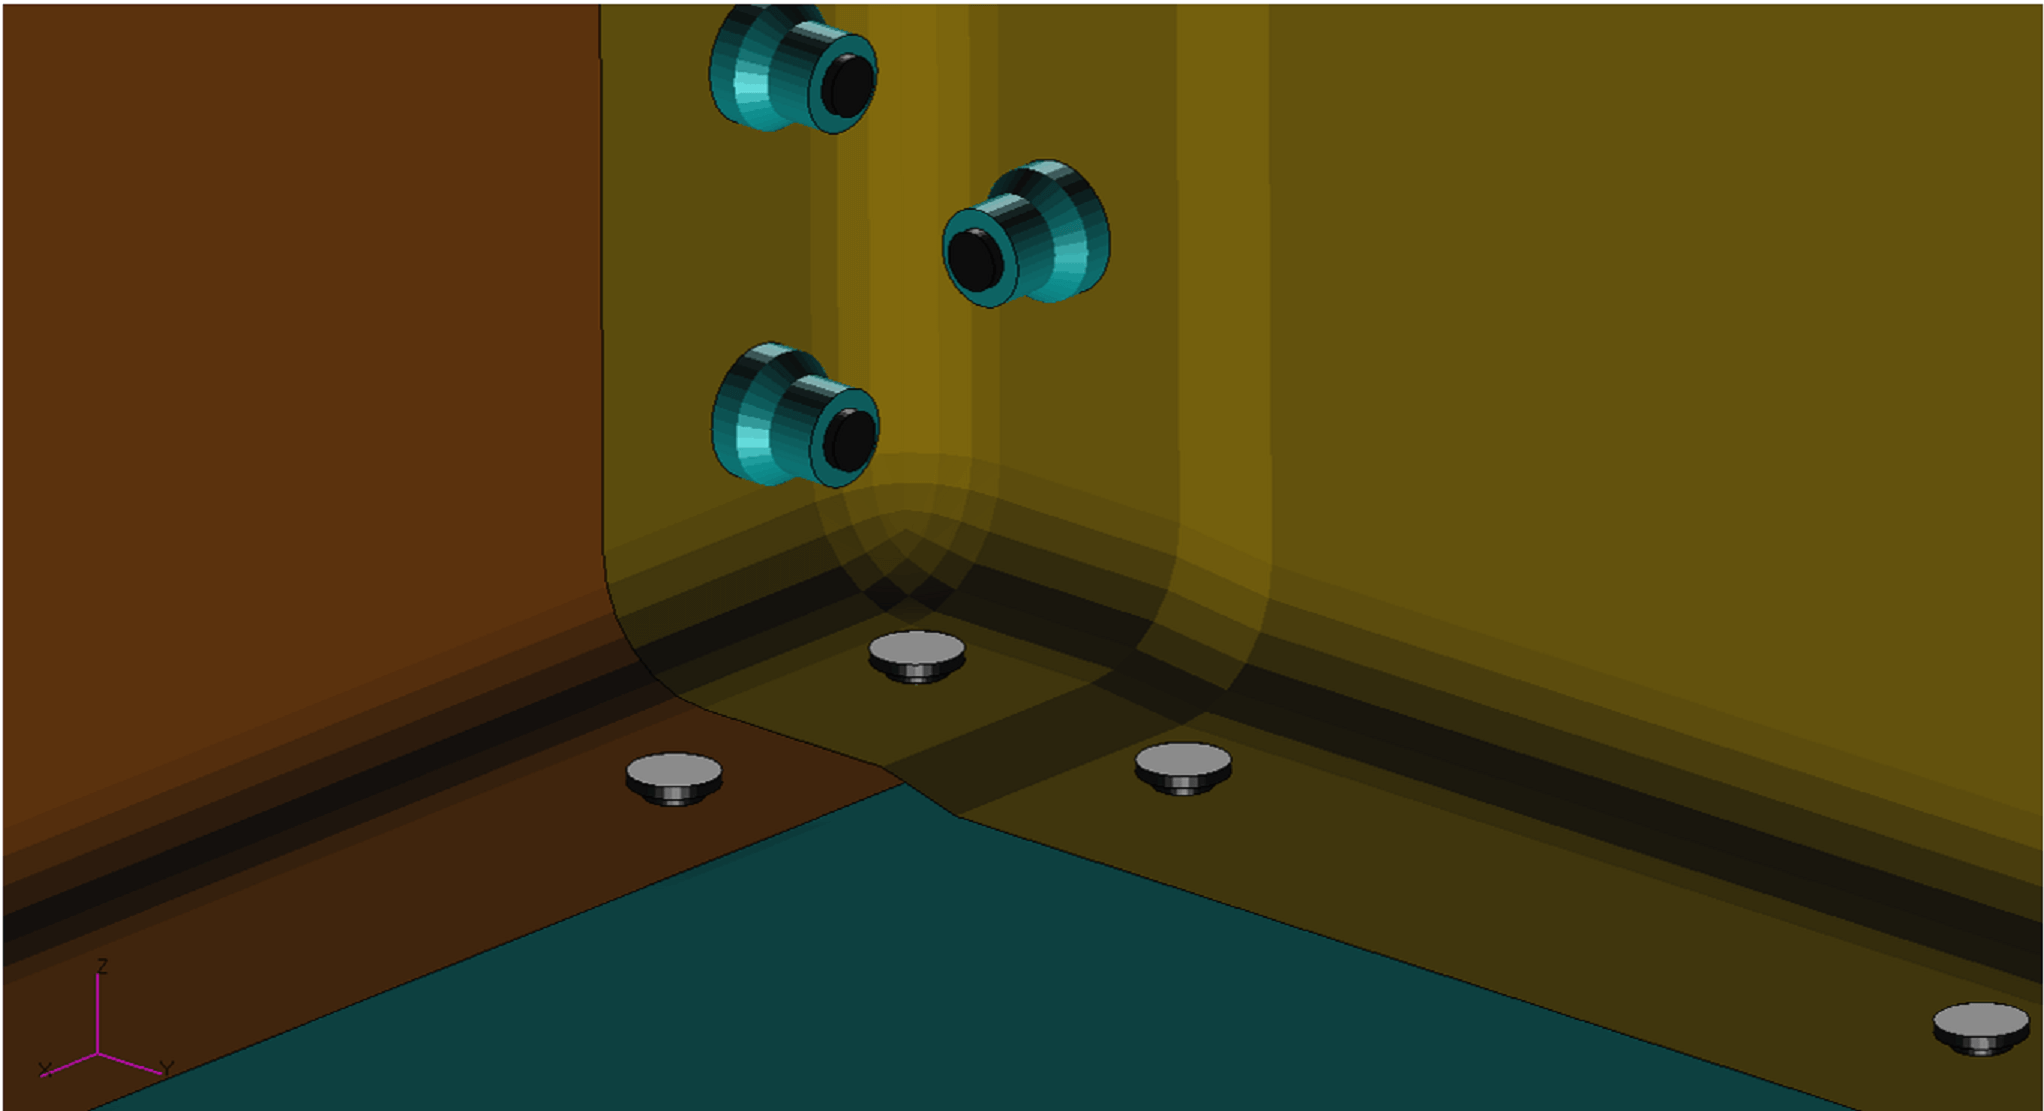
The second model utilised more detailed discretisation at the holes in panels with fasteners, modelled in detail with 3D solid elements. In this representation, a pretension of 500lbf or 2224N was applied, prior to the main loads, to all fasteners in several stages—generally following a live assembly process.
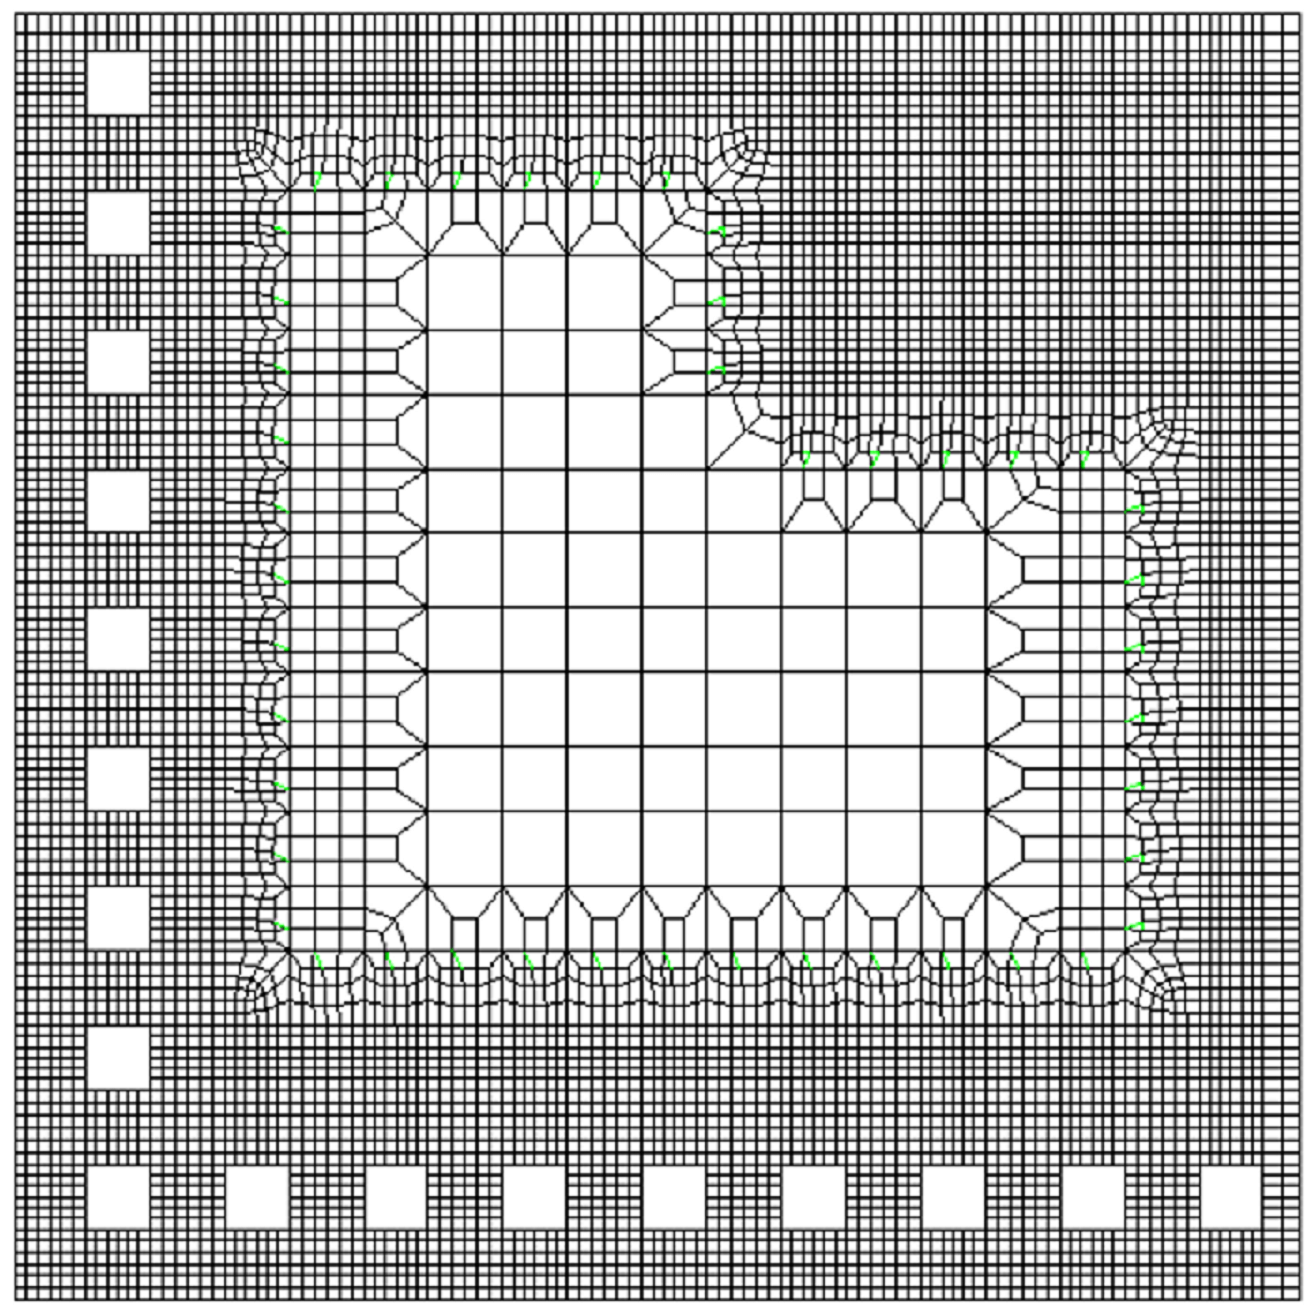
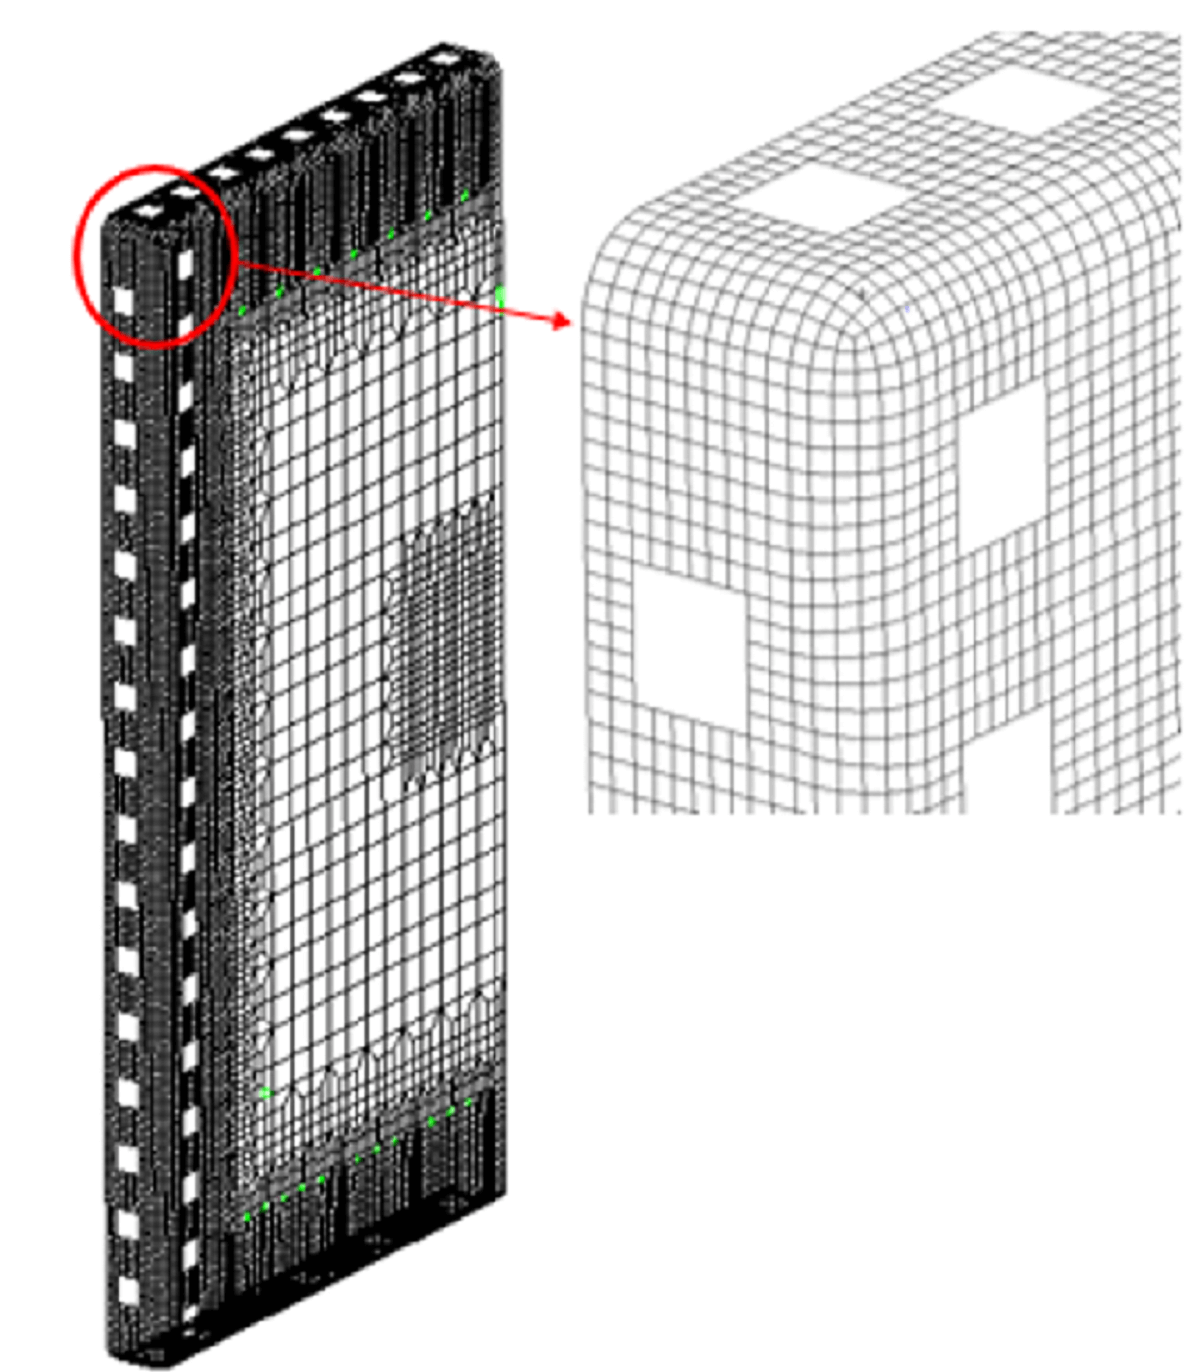
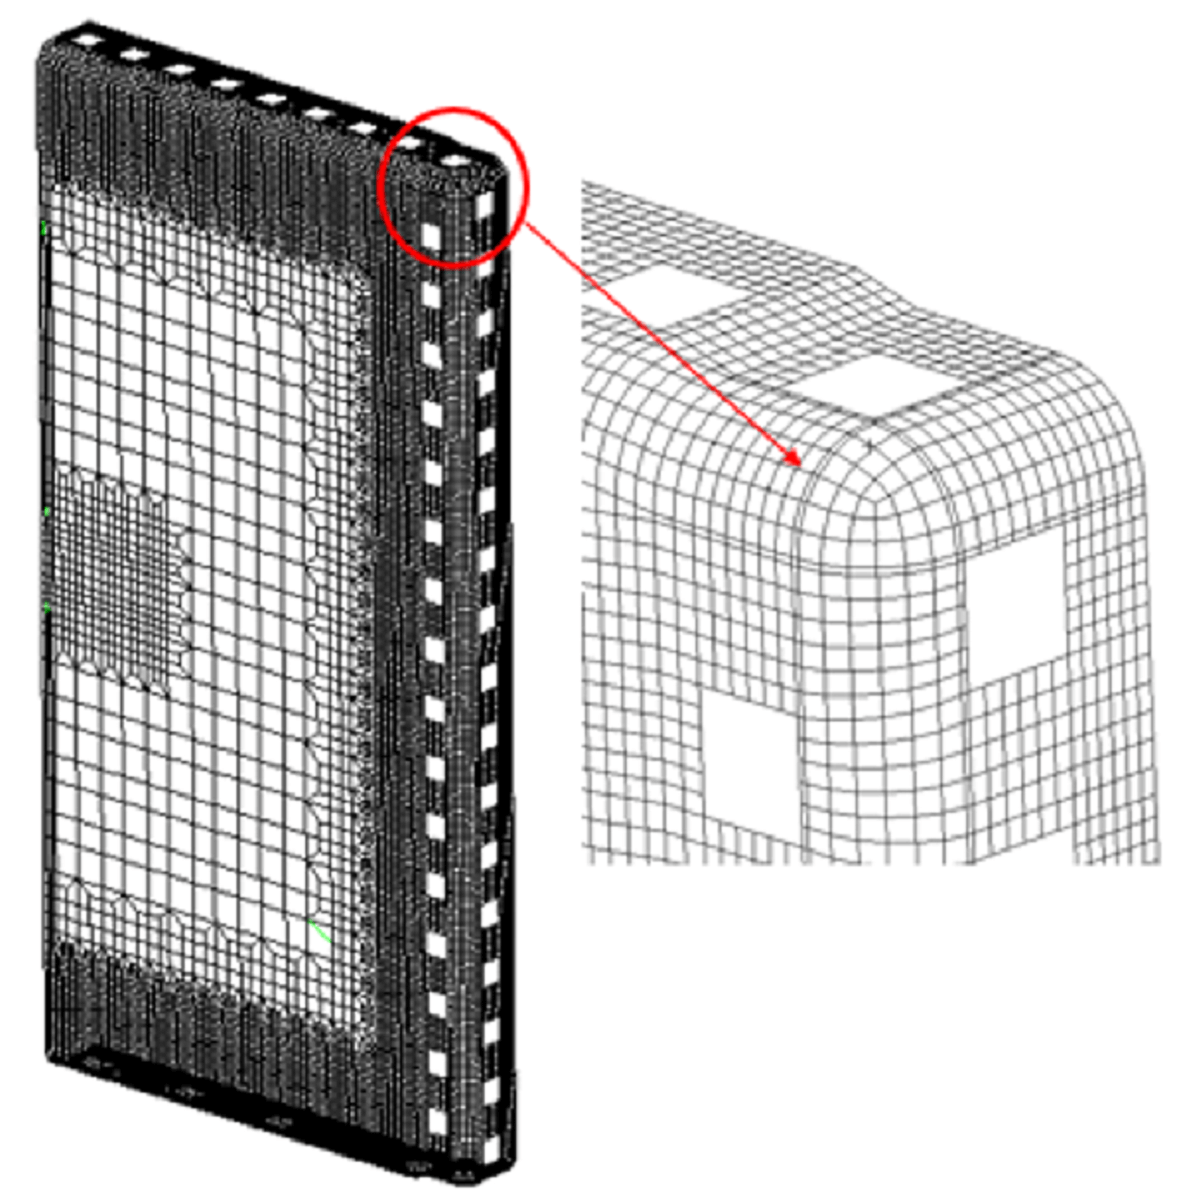
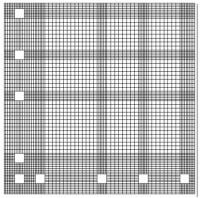
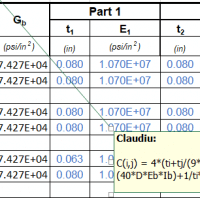
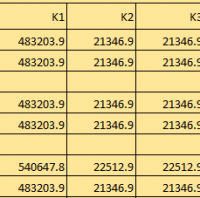
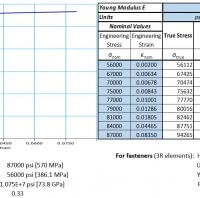
A unique bulk mesh was used for the box, in both models, with the differences being localised to the zones immediately adjacent to the holes. Figures 54 to 65 show representative pictures for the common, and model specific, elements. Properties of the materials used, and samples of the stiffness values used for the fasteners in the first model are also included.
Excluding the pretension faze, the same loading of 25psi external pressure was applied to the models in four stages (0-10, 10-15, 15-20 and 20-25)—followed by pressure removal for the evaluation of permanent set in the panels, and comparative assessment of residual stresses. All surfaces were joining, prior to loads application in both models.
Figure 50
Figure 51
Figure 52
Figure 53
Contact definitions
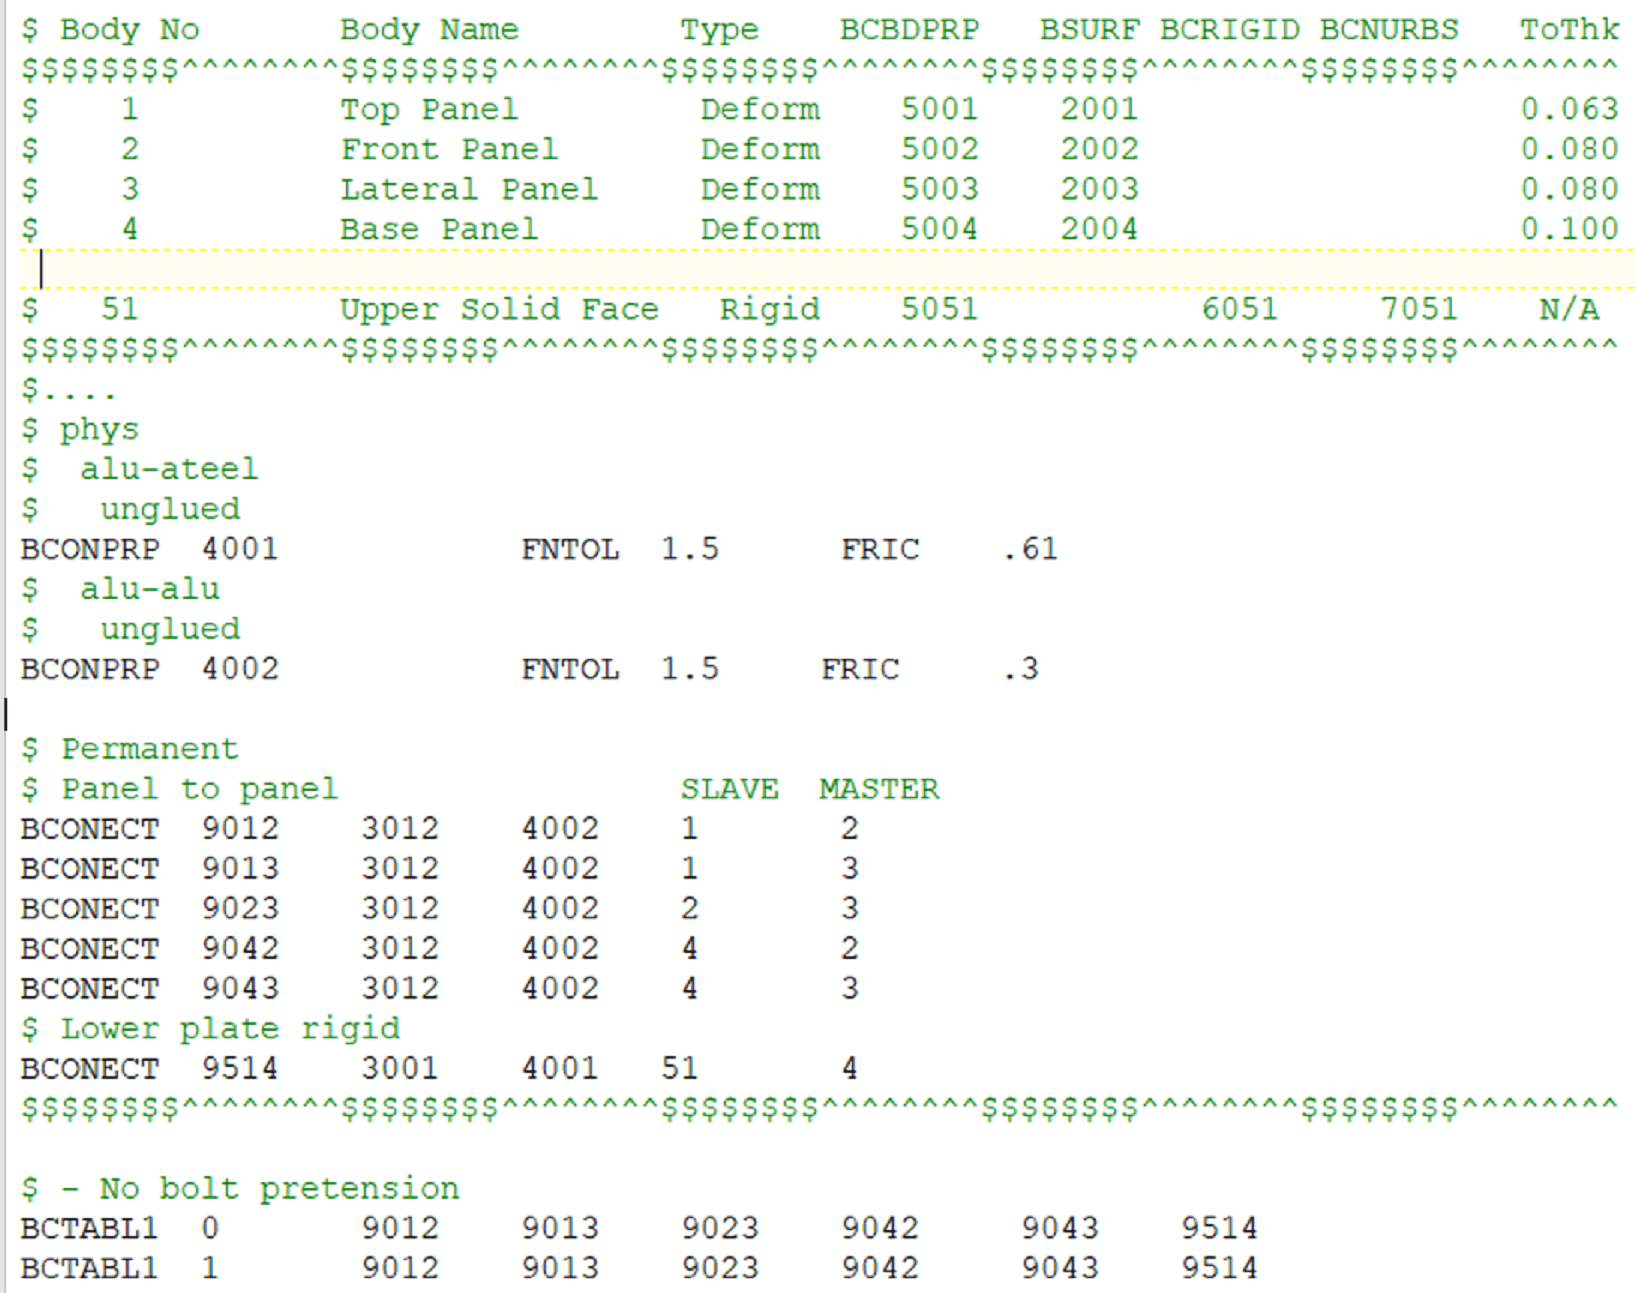
In the first representation, there are six sets of contact surfaces between parts—the last one being the upper rigid surface (contact body 51). In this case, a single additional list of contact pairs (defined through a BCTABL1 entry) is sufficient for the entire loading-to-unloading cycle, after the enforcement of the initial contact conditions (just joining) with BCTABL1=0.
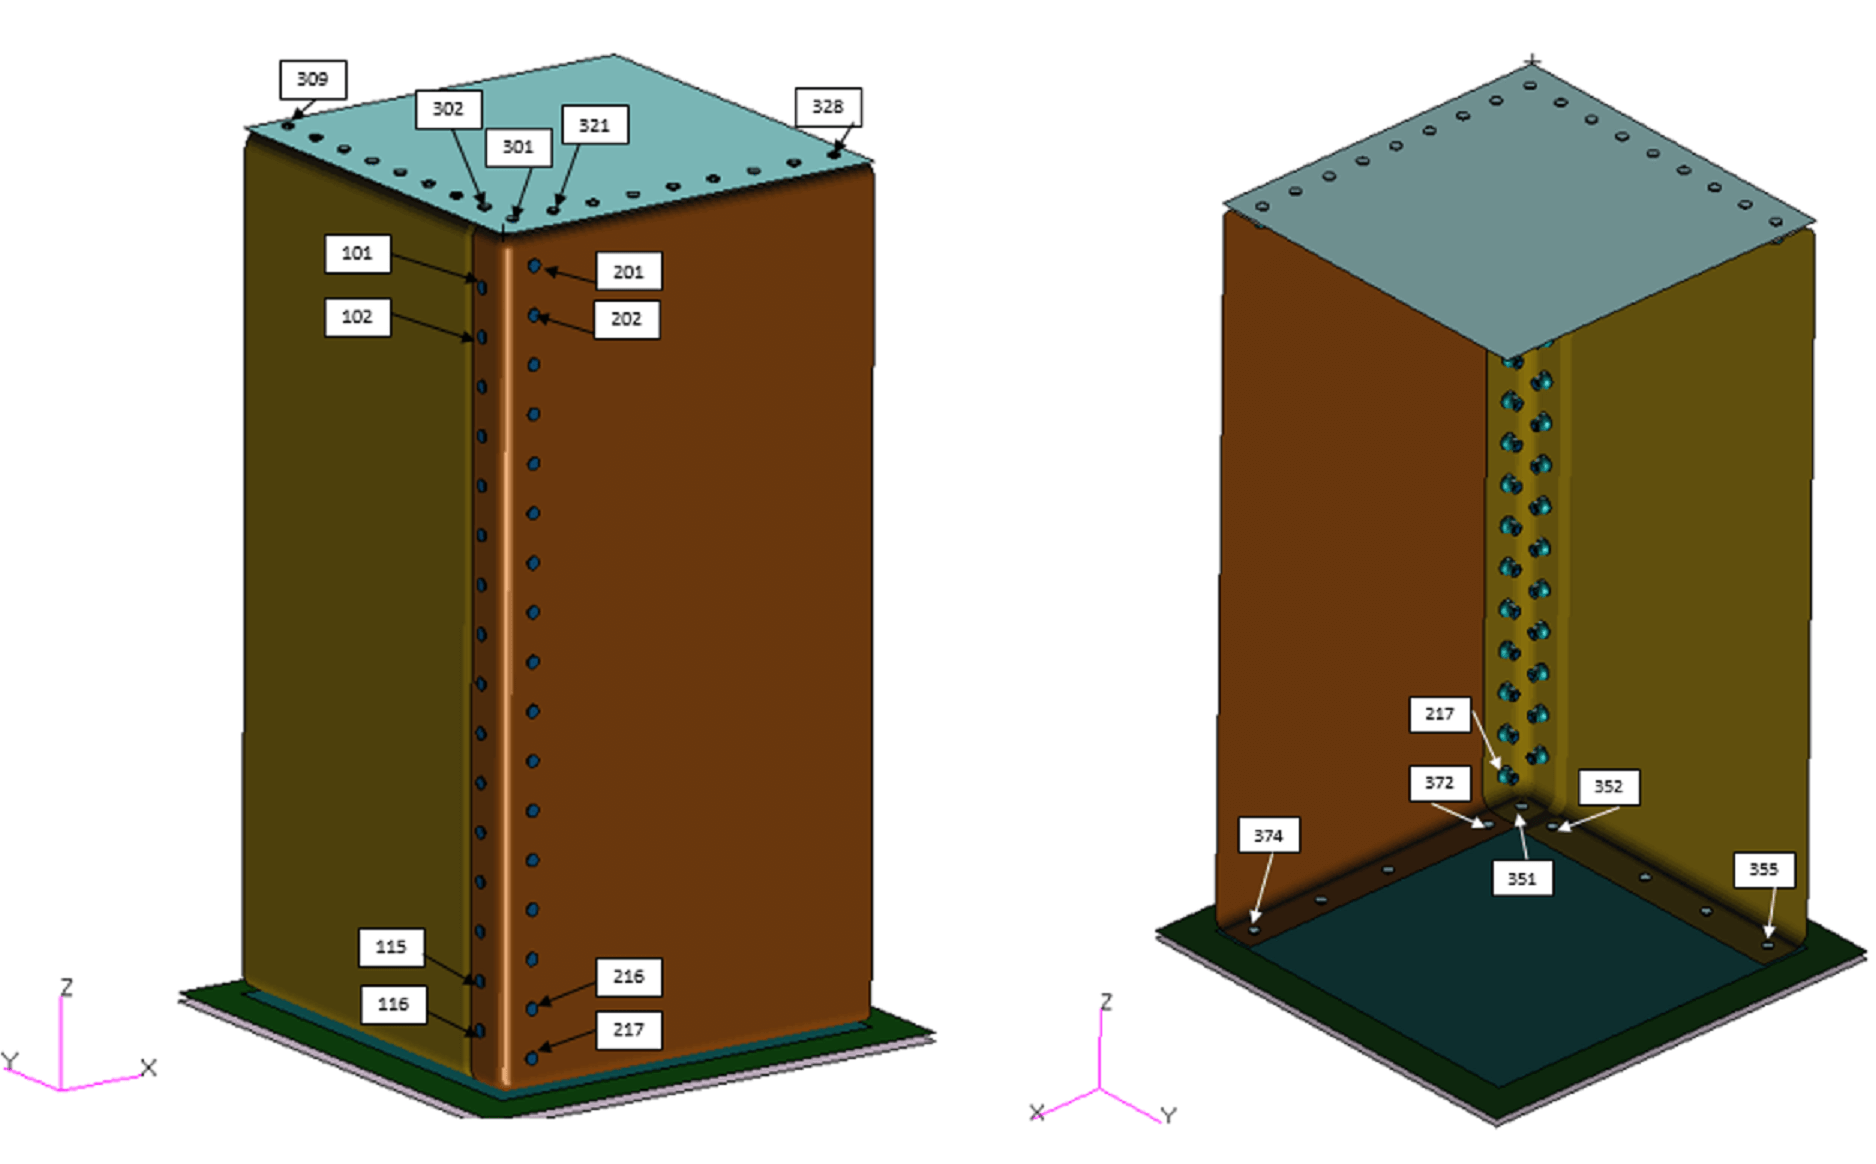
At the bottom of figure 66, the two entry cards belonging to the six sets of contact surfaces can be seen. Above them, cards for the definition of touching, and touched, contact bodies (BCONECT), and the physical contact parameters between these bodies (BCONPRP). Additionally, the geometrical contact parameters, used by the solver to determine when contact occurs between two bodies, are defined in the card with id 3012 (not shown in the extract in figure 66).
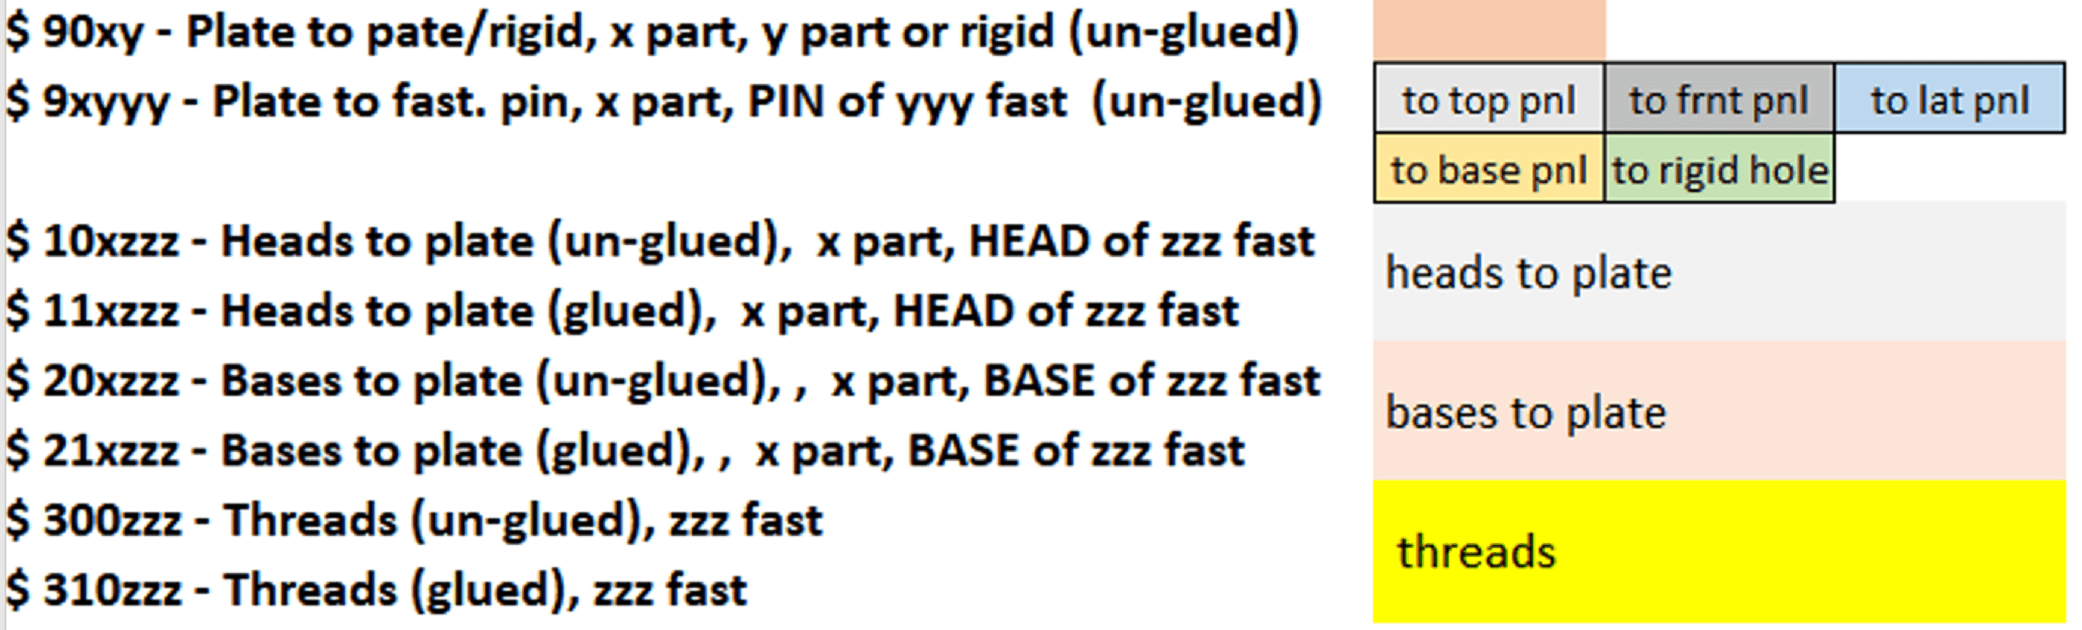
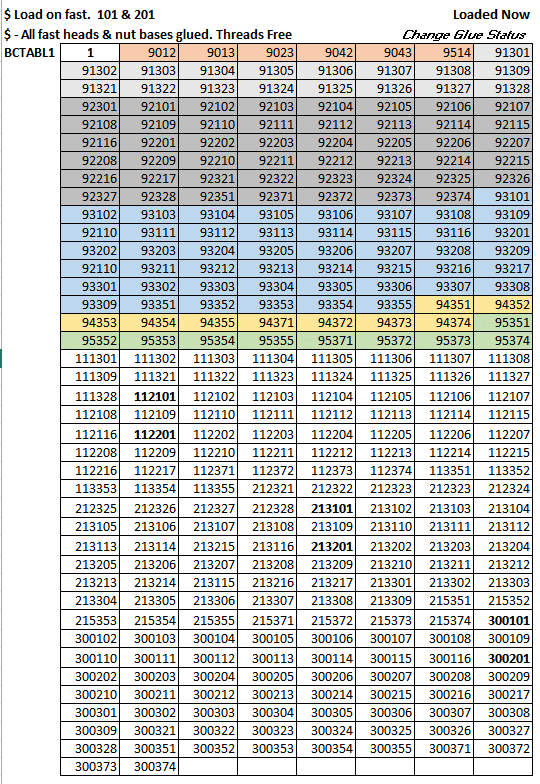
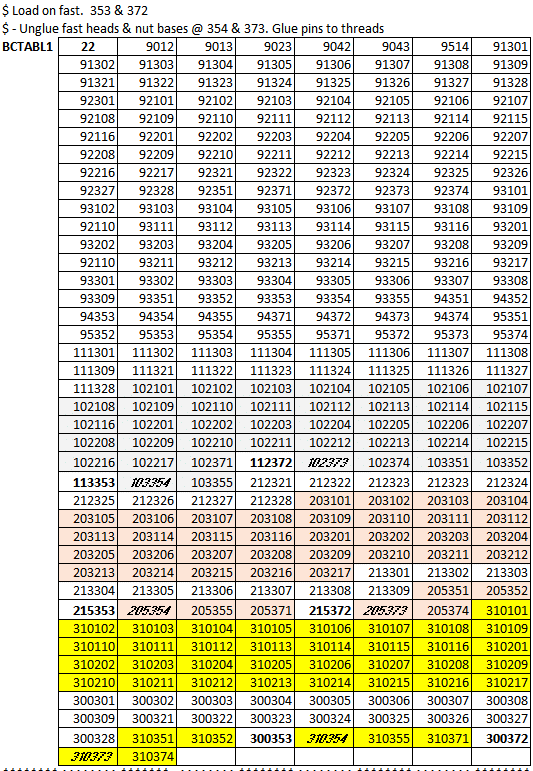
In the detailed model, the bolts and collars of the 51 fasteners were separated into two bodies each, to enable threads locking after pretension and the gluing of bolt heads and nut bases to their bases, prior to pretension, to prevent rigid body singularities. In this arrangement, the model has 251 contact bodies, with 313 contact surfaces and over 450 contact configurations, that require a more detailed approach in model building—and for the definition of the contact characteristics during the pretension loading, which was applied in 27 steps. Figure 67 shows a colour-coded sample of the tables required for the definition of contact parameters during the pretension and main loading/unloading—shown in figures 66 to 70. The supplementary pre-processing work, required by the inclusion of 102 additional contact bodies, was compensated for during the solution time and post-processing of results.
Figure 66
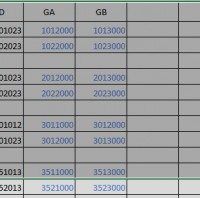
Codification and colour codes
Figure 67
Figure 68
Figure 69
Figure 70
Short brief of results
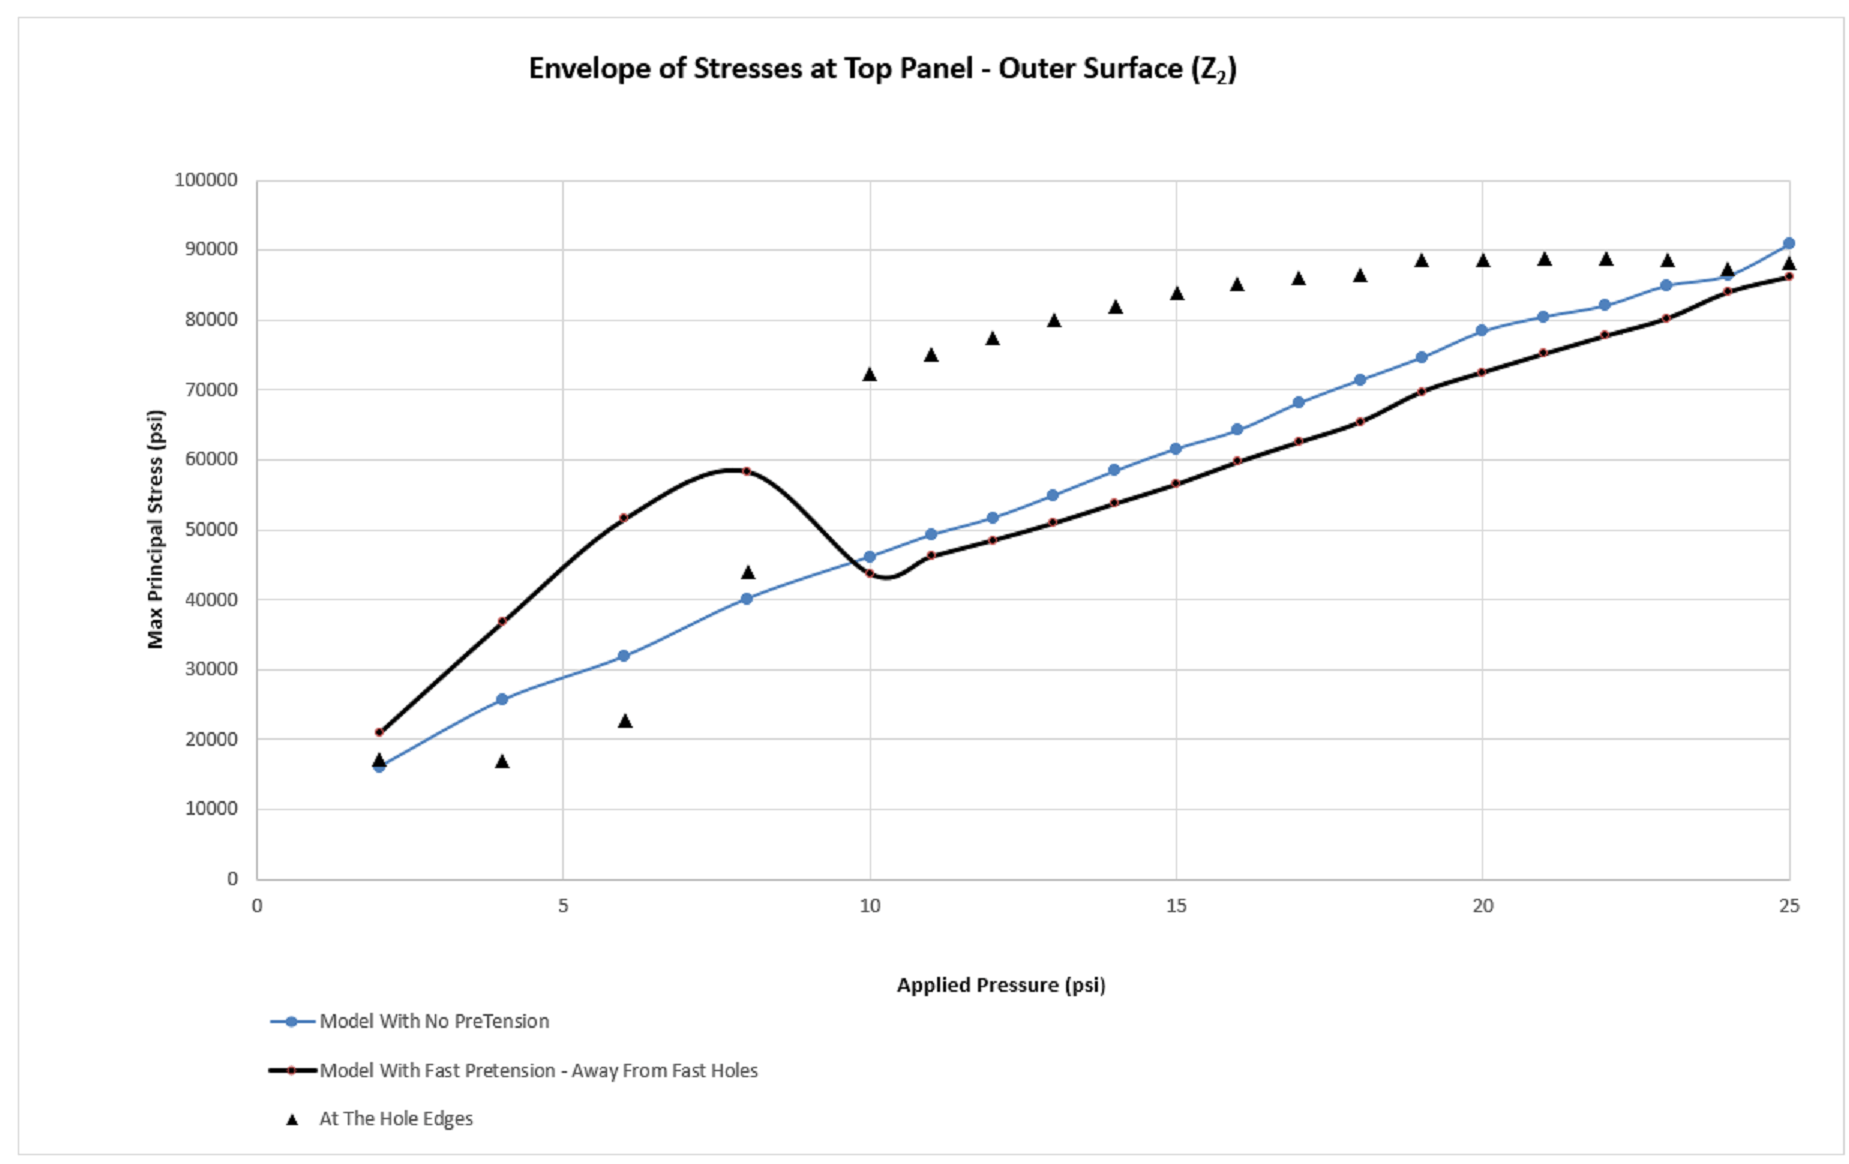
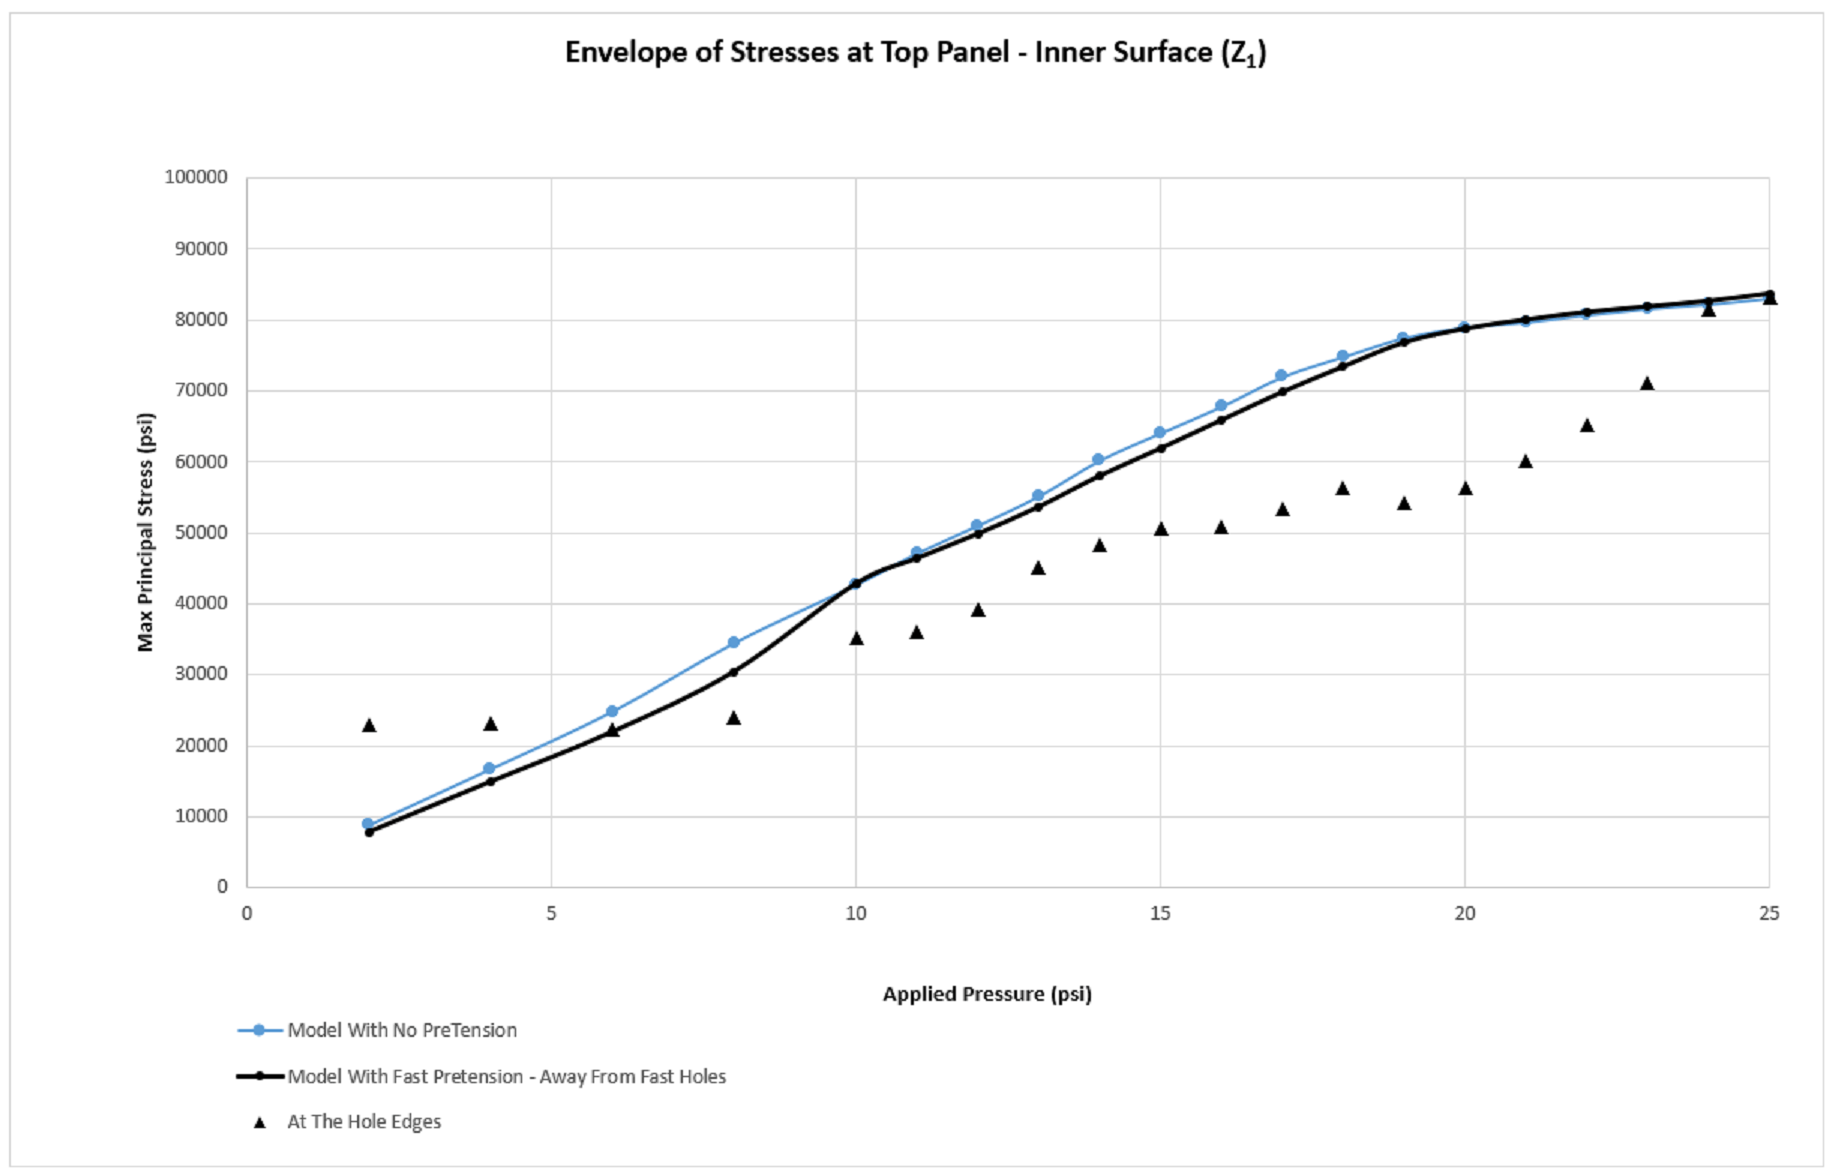
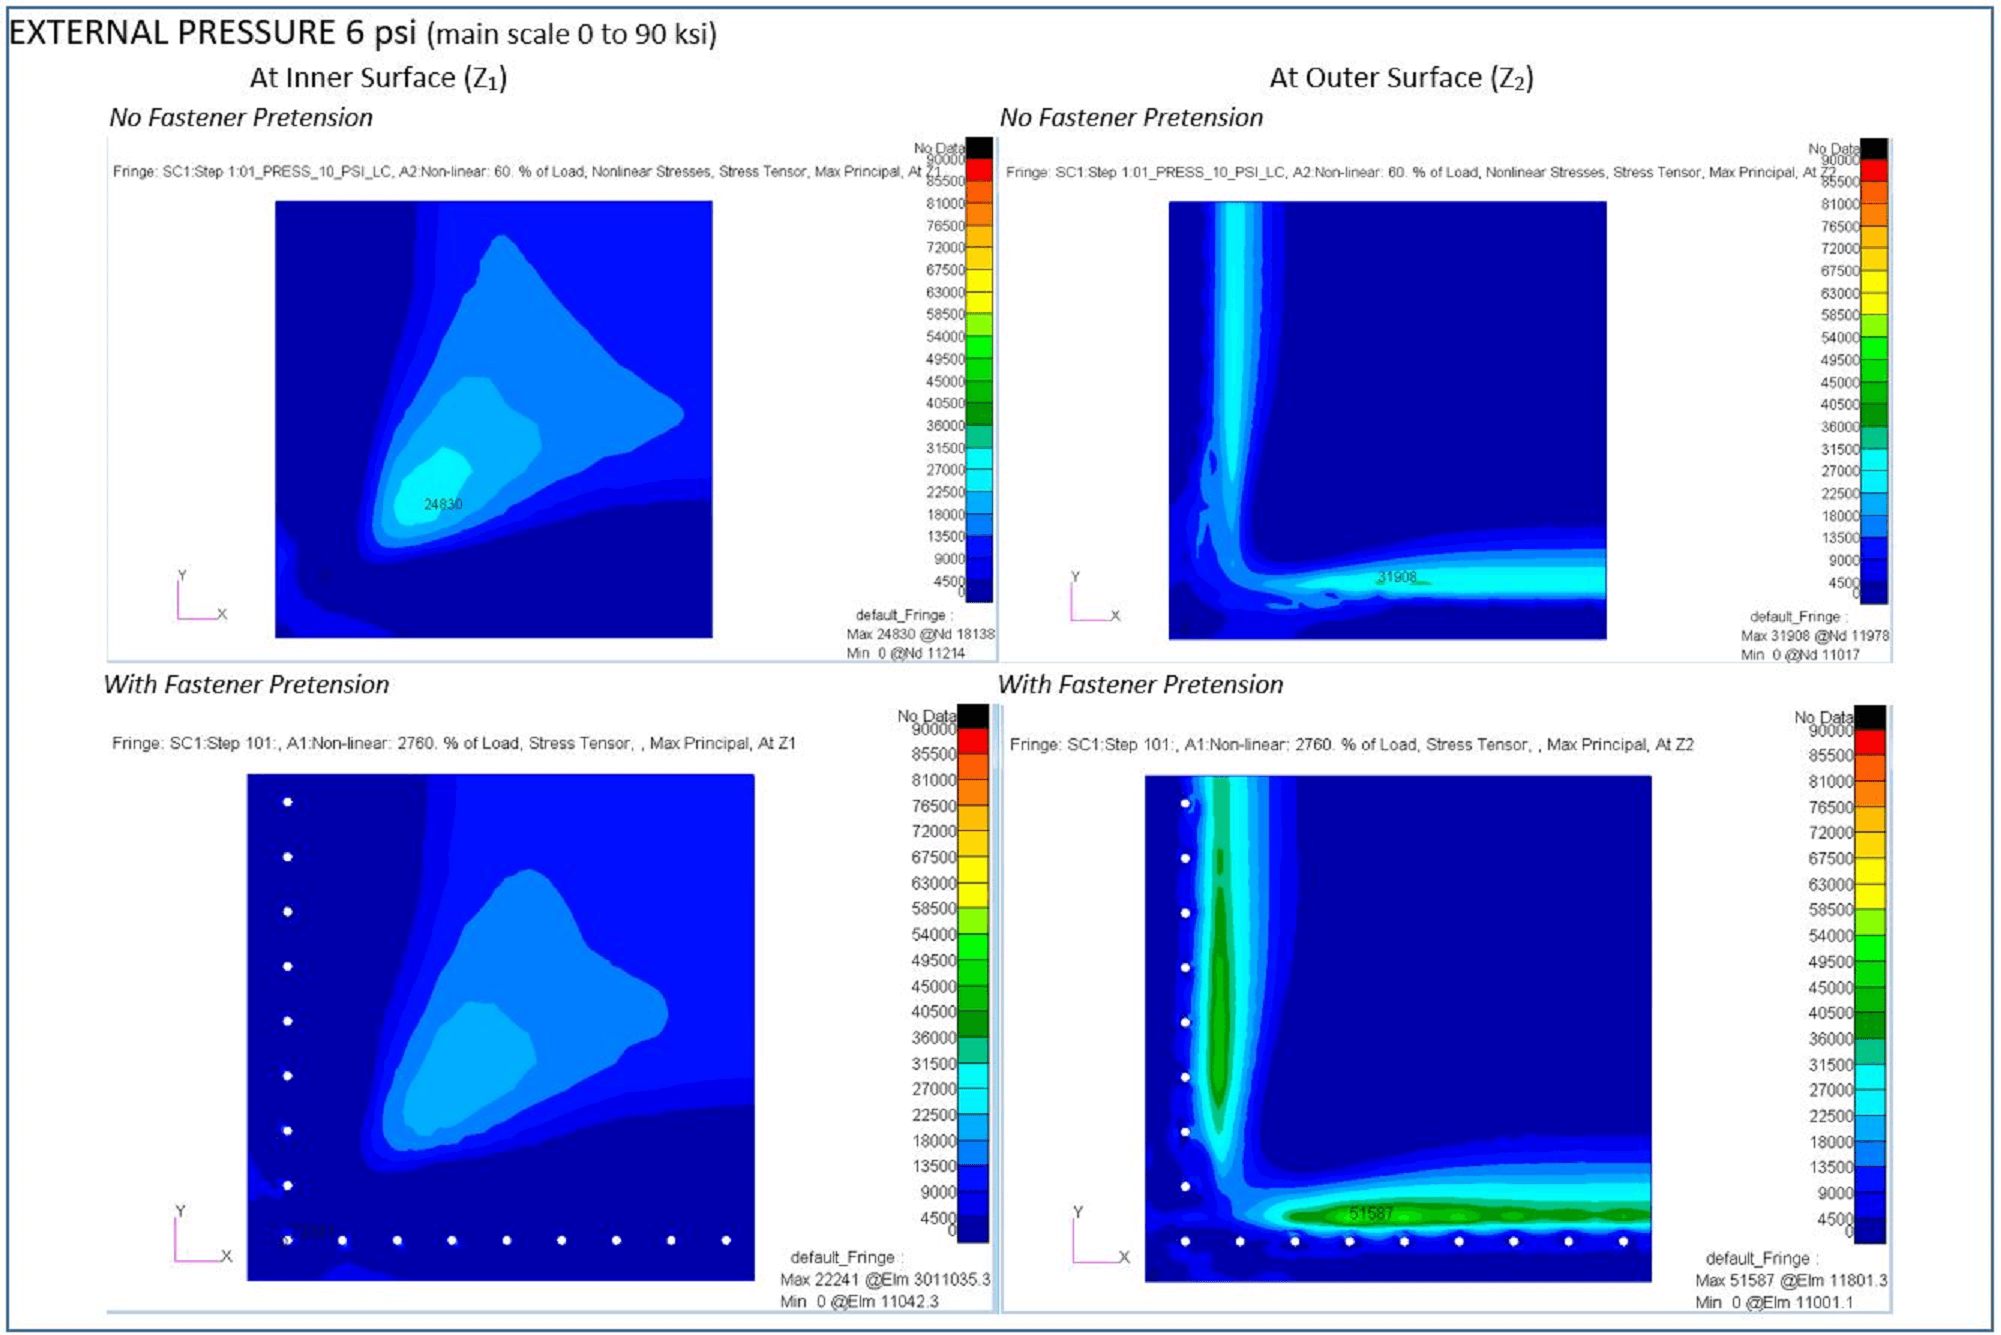
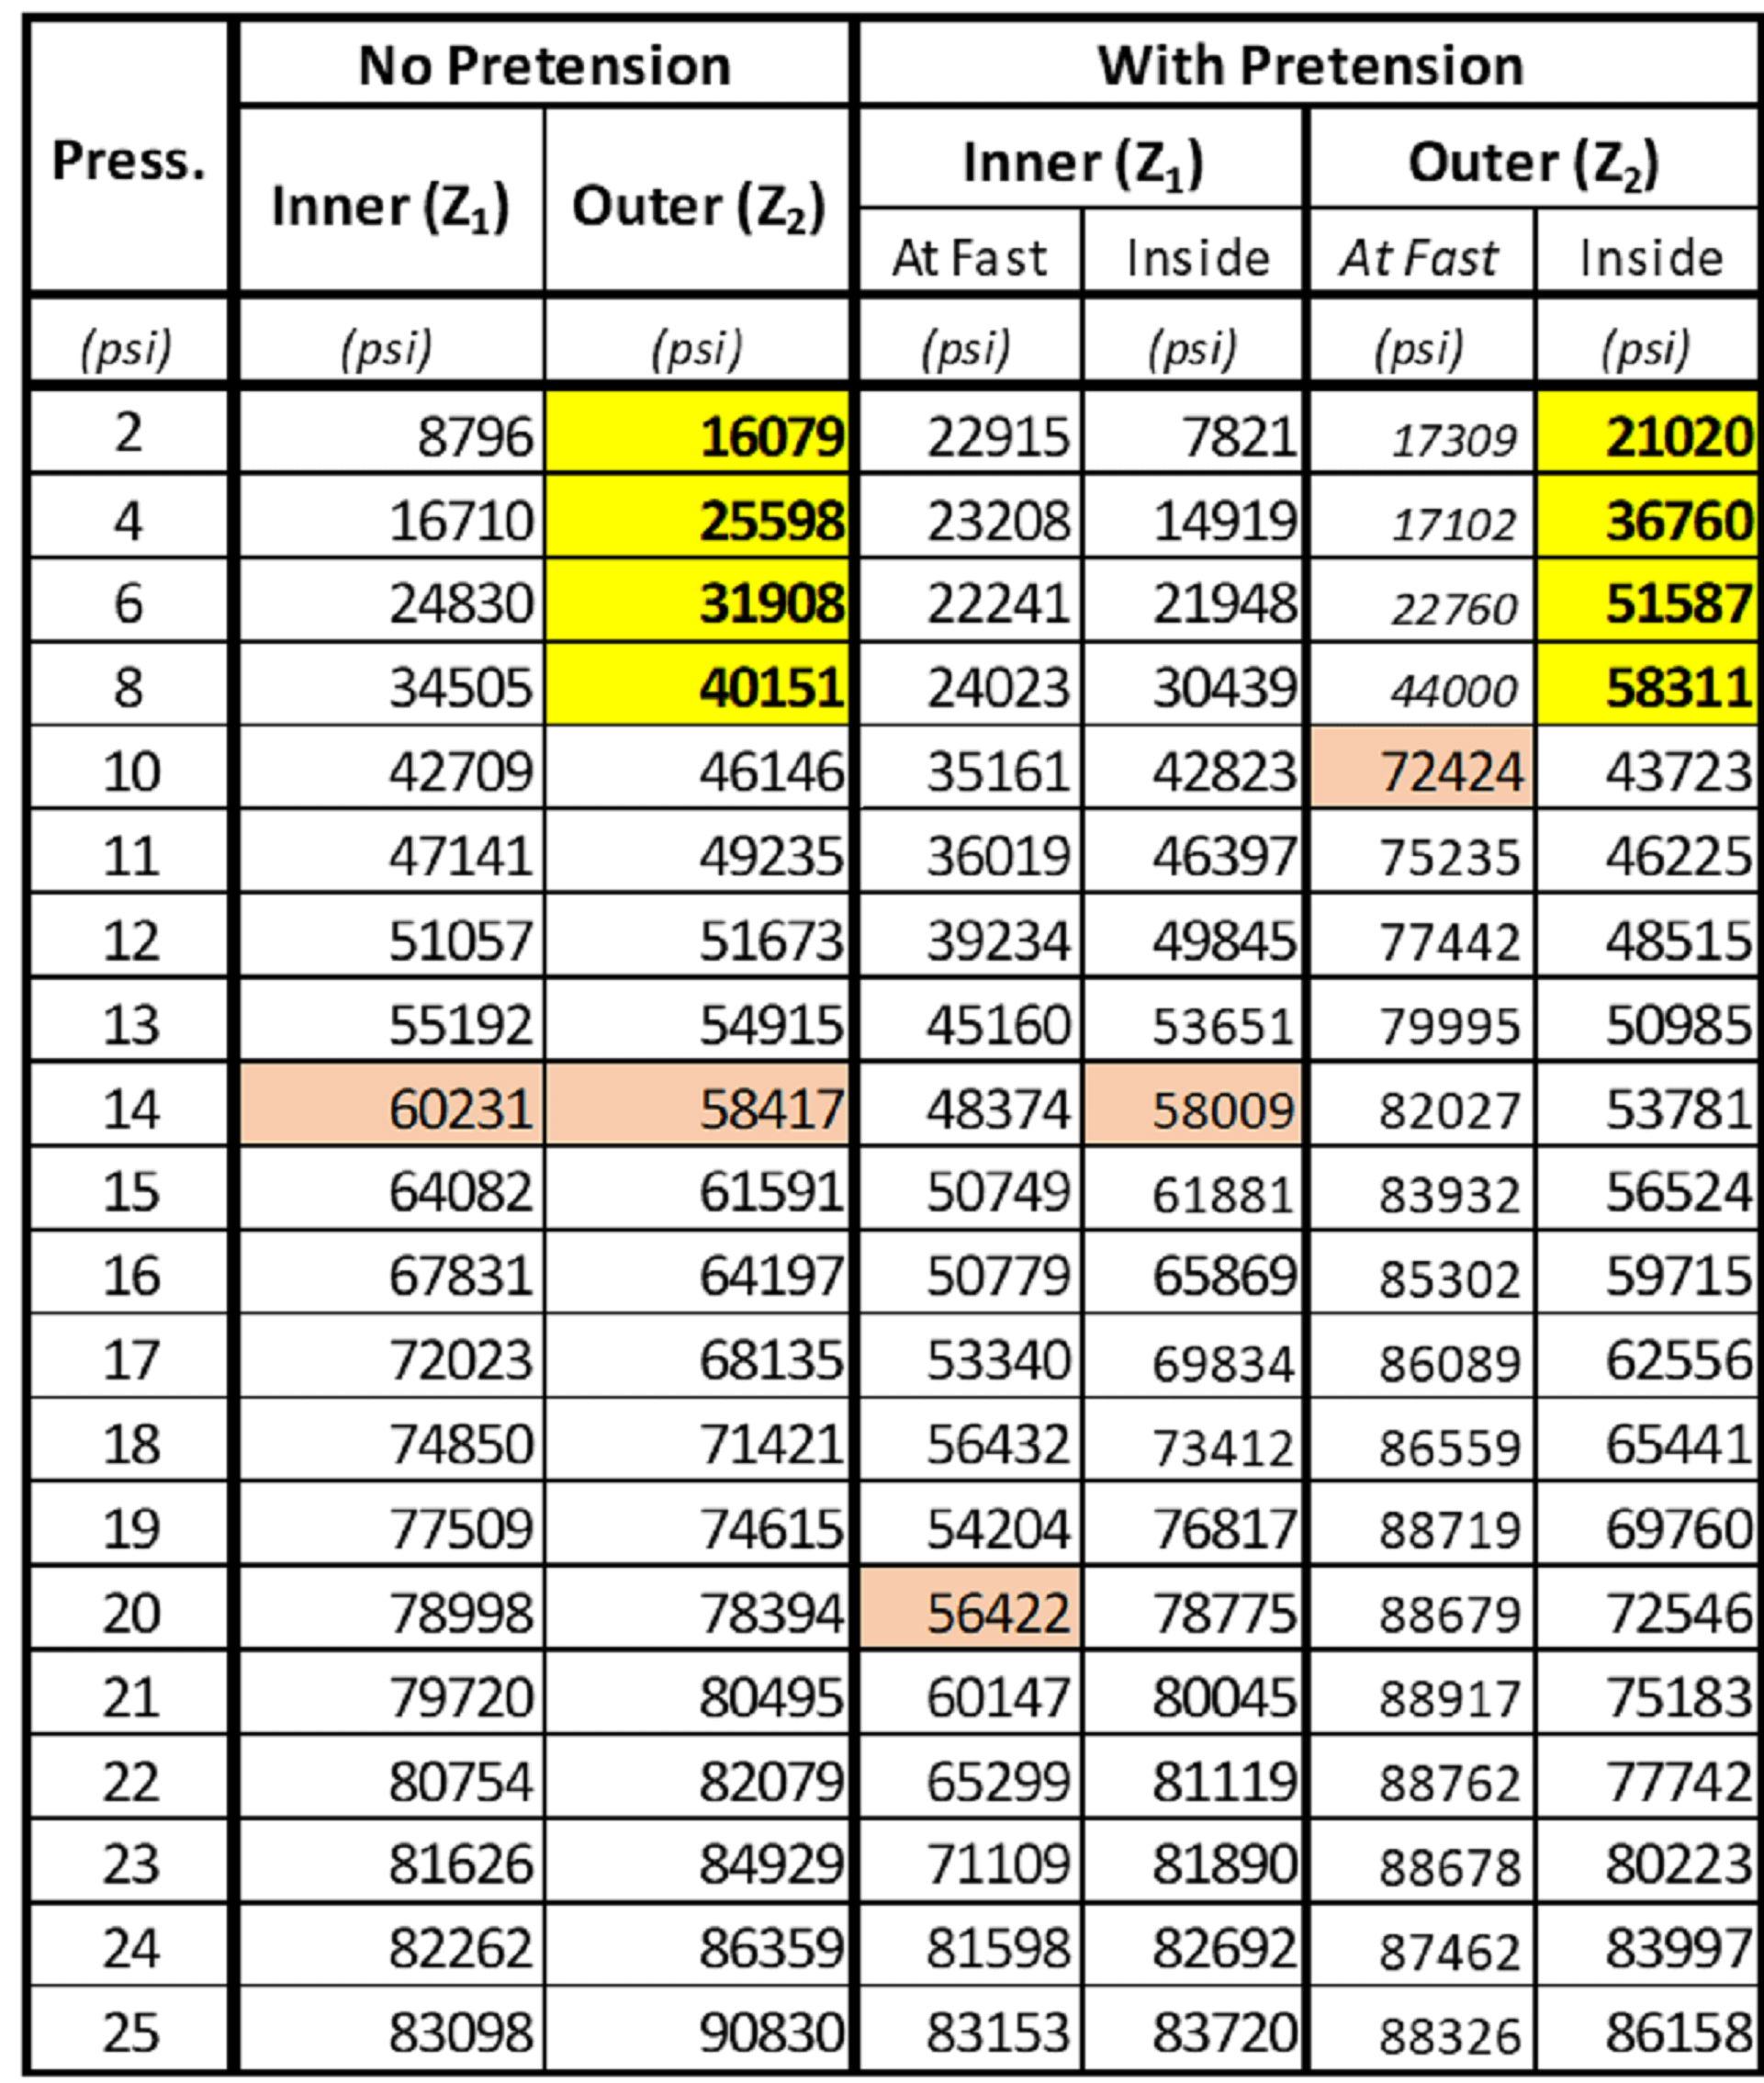
In elastic range, the predictions for maximum principal stresses on the outer surface of the top panel were up to 60% smaller when fastener pretension was not accounted for. The maximum stresses occurred near the supports (pivoting line) at the free ends of the flanges in the vertical panels, and were some distance from the fastener holes. Large differences in values occur for the entire elastic range of the material. Support configurations for large un-flanged panels, supported and loaded in a similar manner, are common in many practical situations (eg. pressure bulkhead, rib webs in wet wings). The implications of these differences, from a fatigue and damage tolerance perspective, are clear: in plastic range, the stress differences between the two models are negligible, from an engineering perspective.
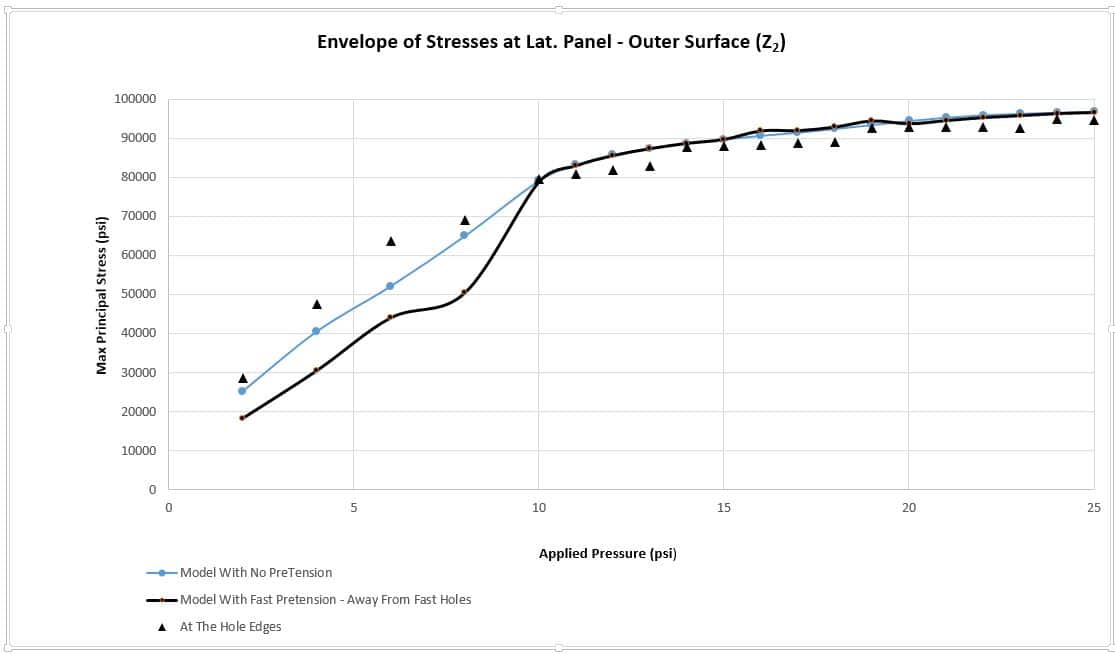
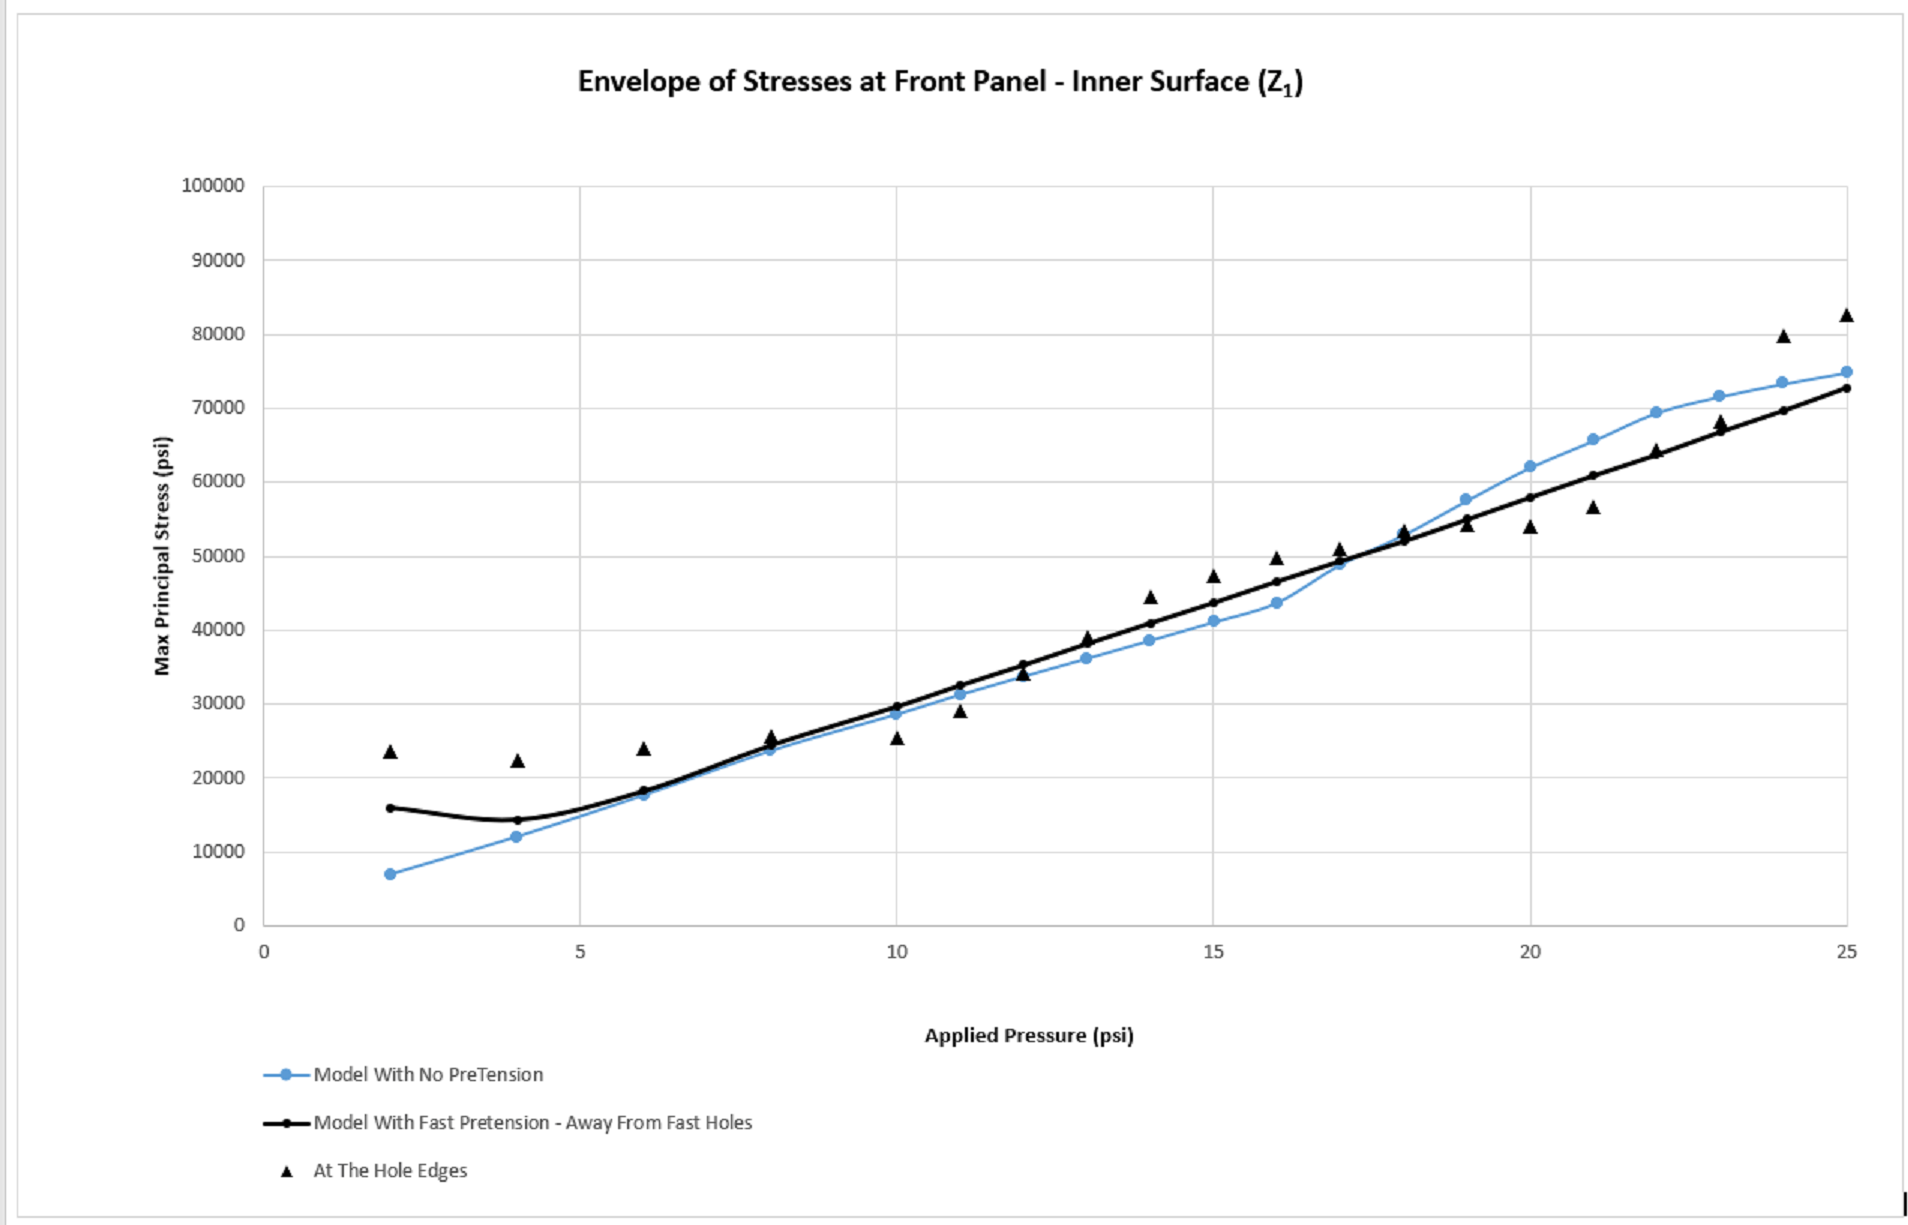
For the front and lateral panels, the maximum stresses develop, as expected, at the flange fillets. The first model provides conservative results in the elastic range, however, a stress pattern, similar to that described above, is noticeable at the front panel—along the edge of the flange in the lateral panel. In plastic range the differences in maximum principal stresses are also negligible.
The reason for differences in elastic range for the two types panels (un-flanged vs flanged) resides in the restraint role of the fasteners, that can only be captured by the second model. Explanations of these restraints, together with additional graphs for the stress envelopes and maximum deformations, are presented in Figure 85.
Front panel
Lateral panel
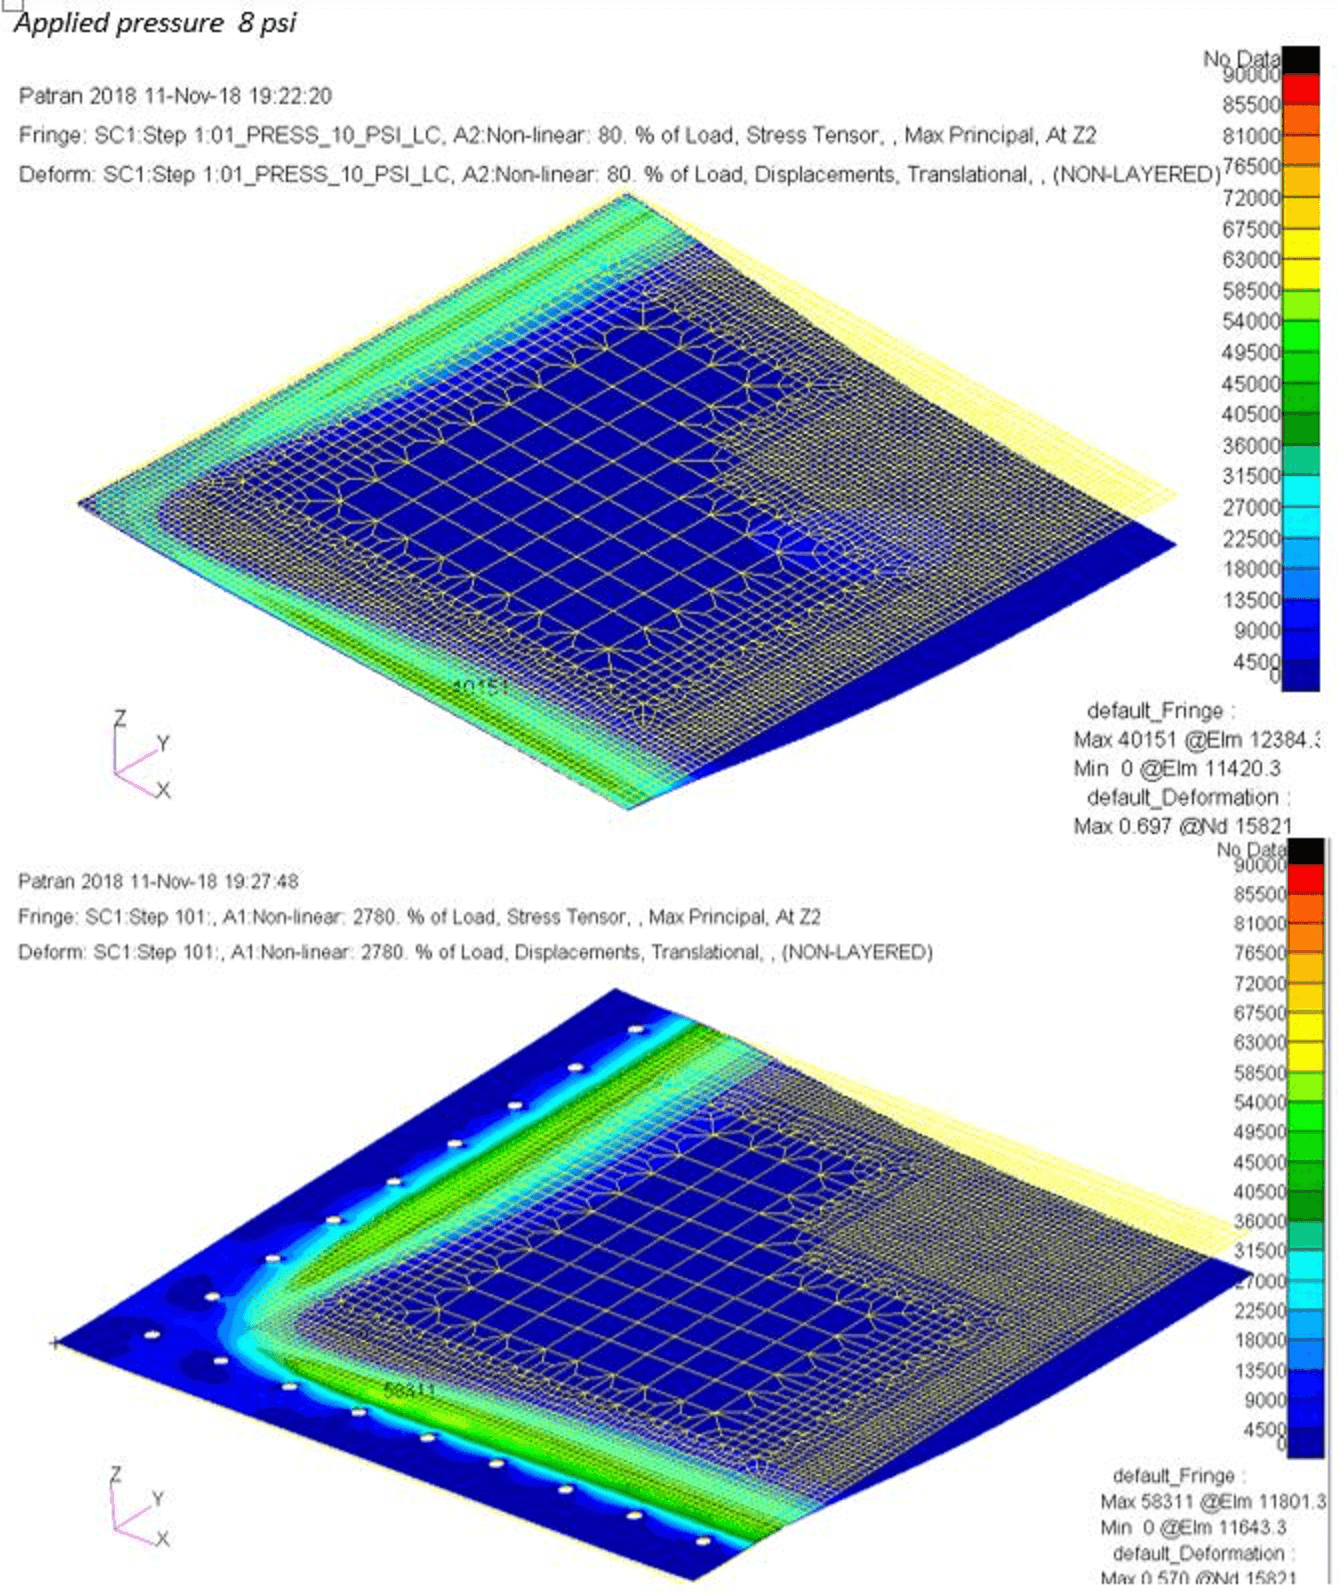
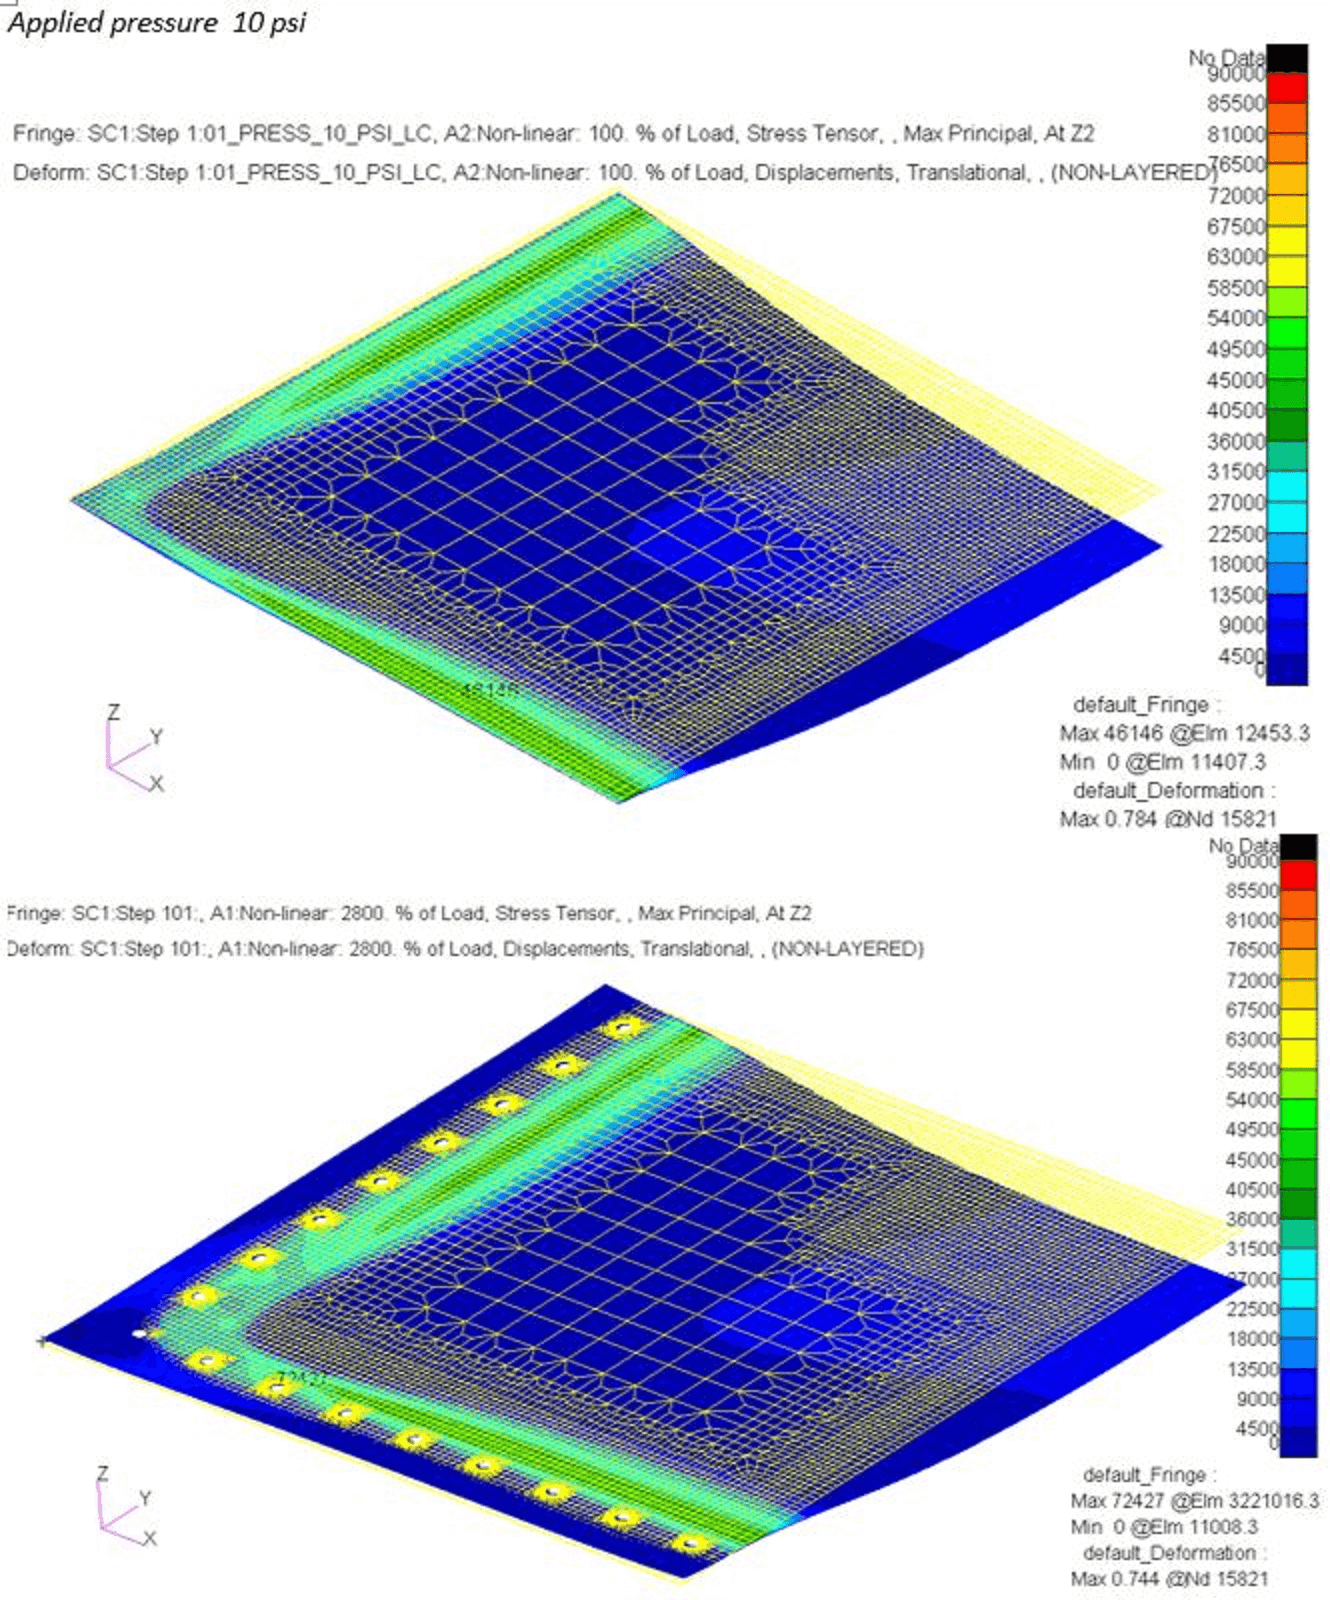
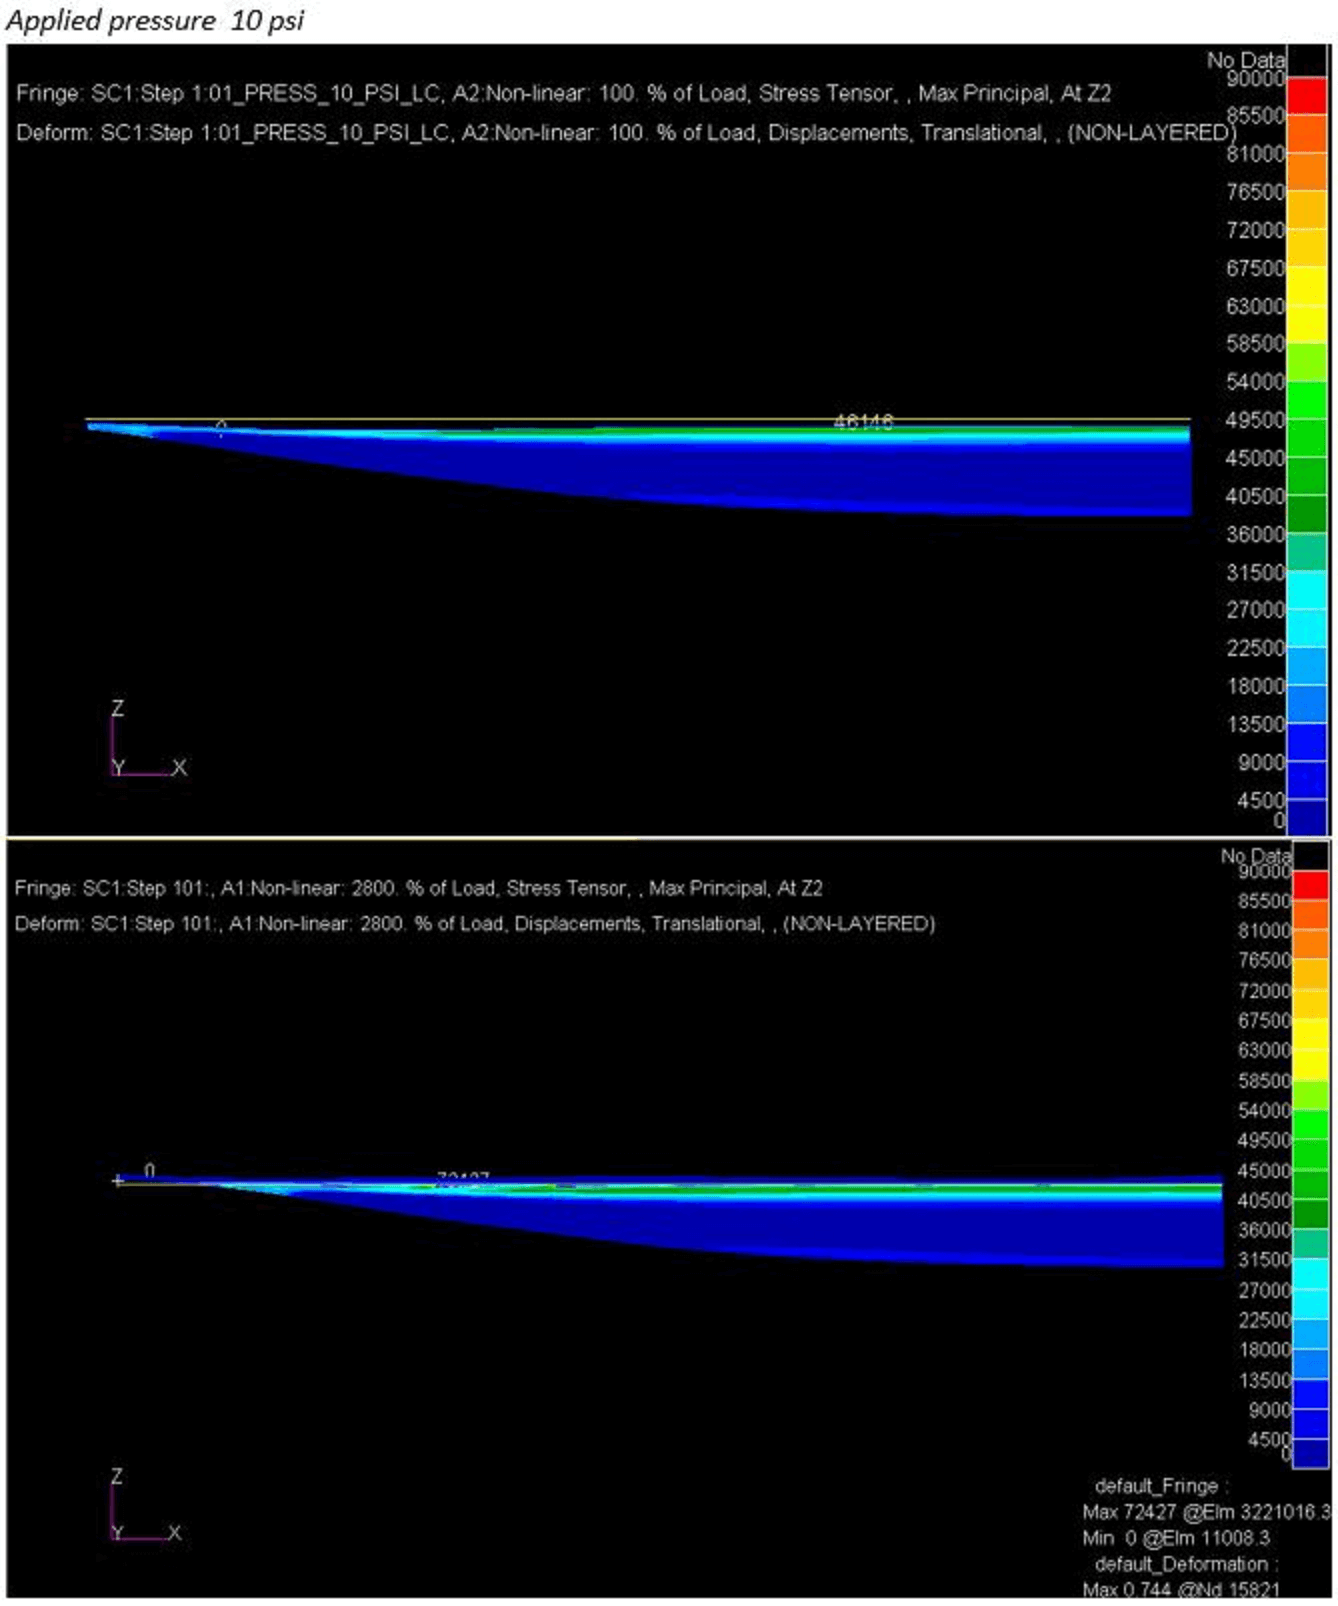
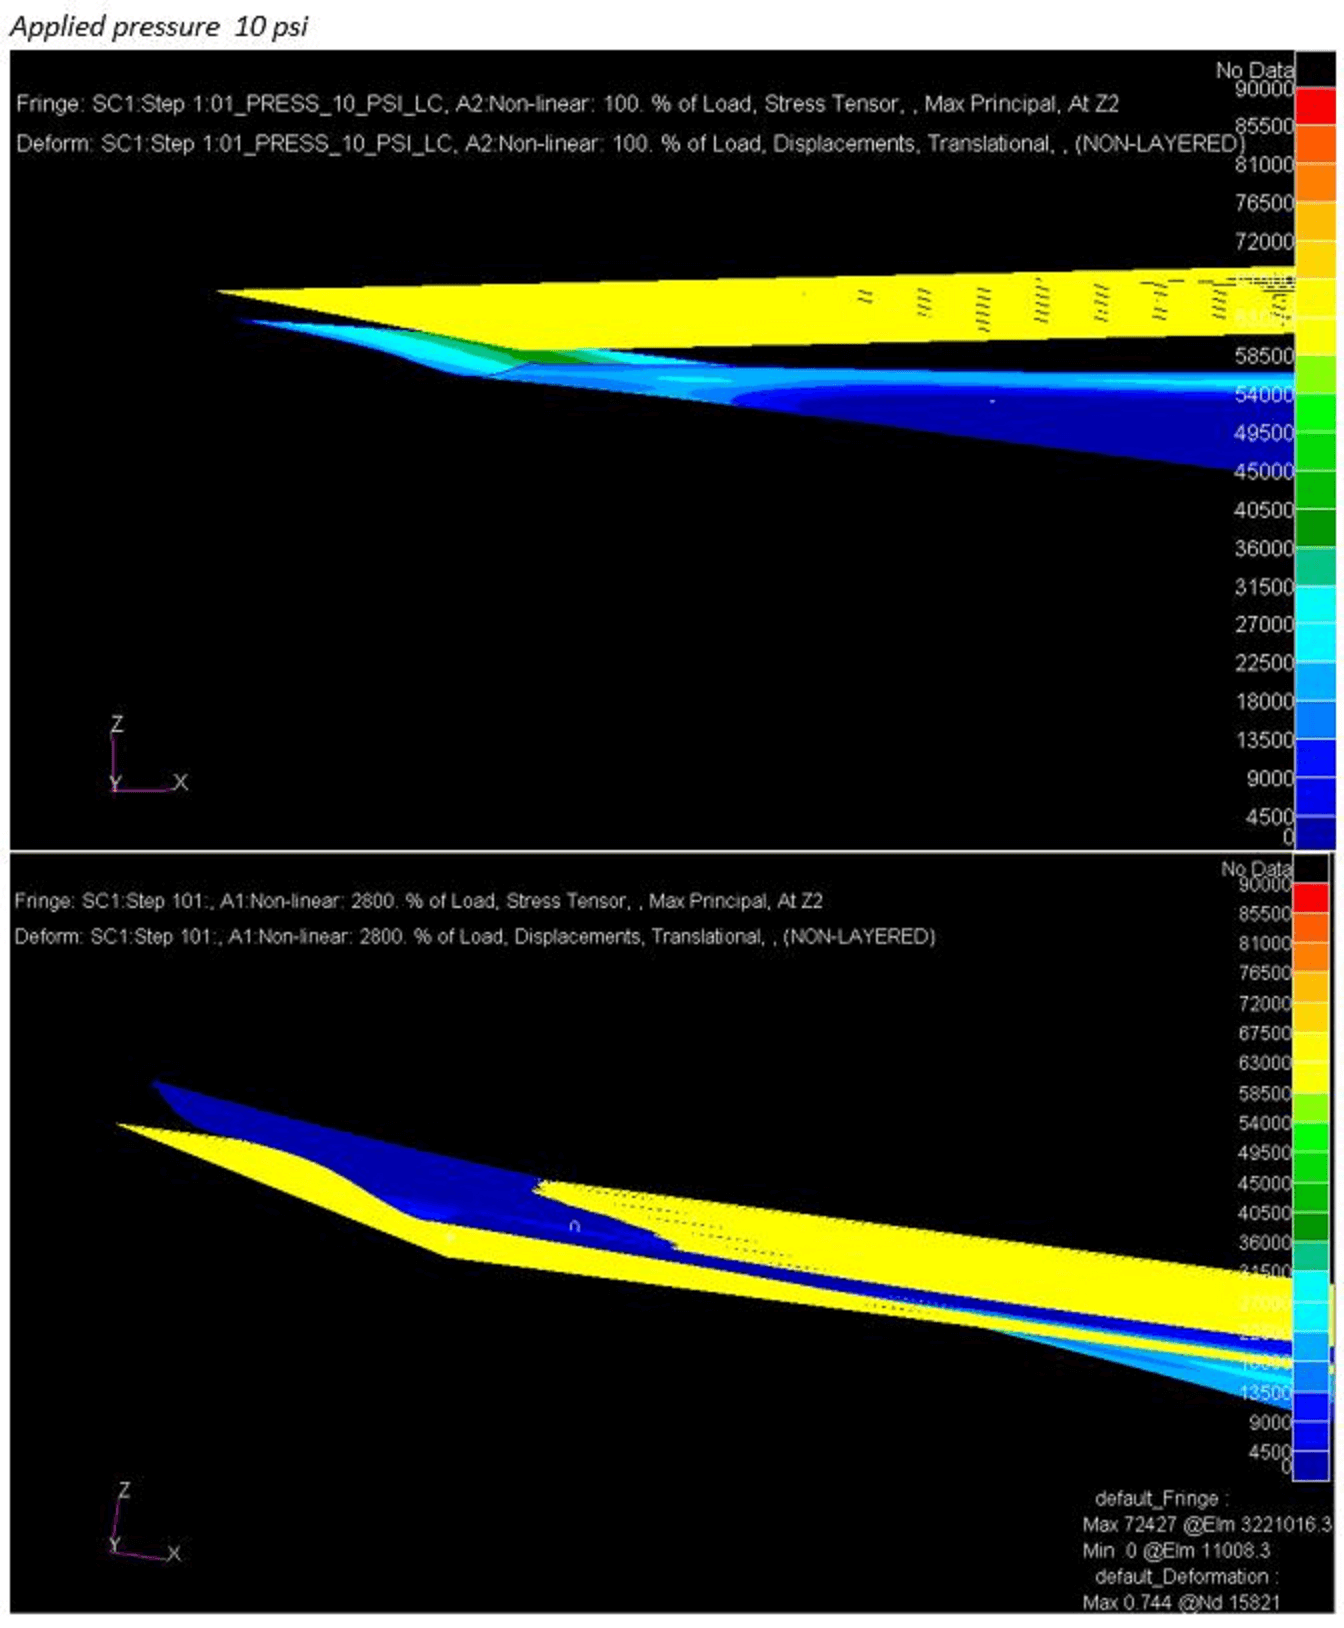
Incorporating fastener pretension in a contact enabled analysis reduces the maximum deformations by more than 20% in the elastic range, and less than 10% in plastic. The overall deformed shape is also affected, with the most noticeable differences at the free edges and, in this case, after the initiation of buckling between two consecutive fasteners.
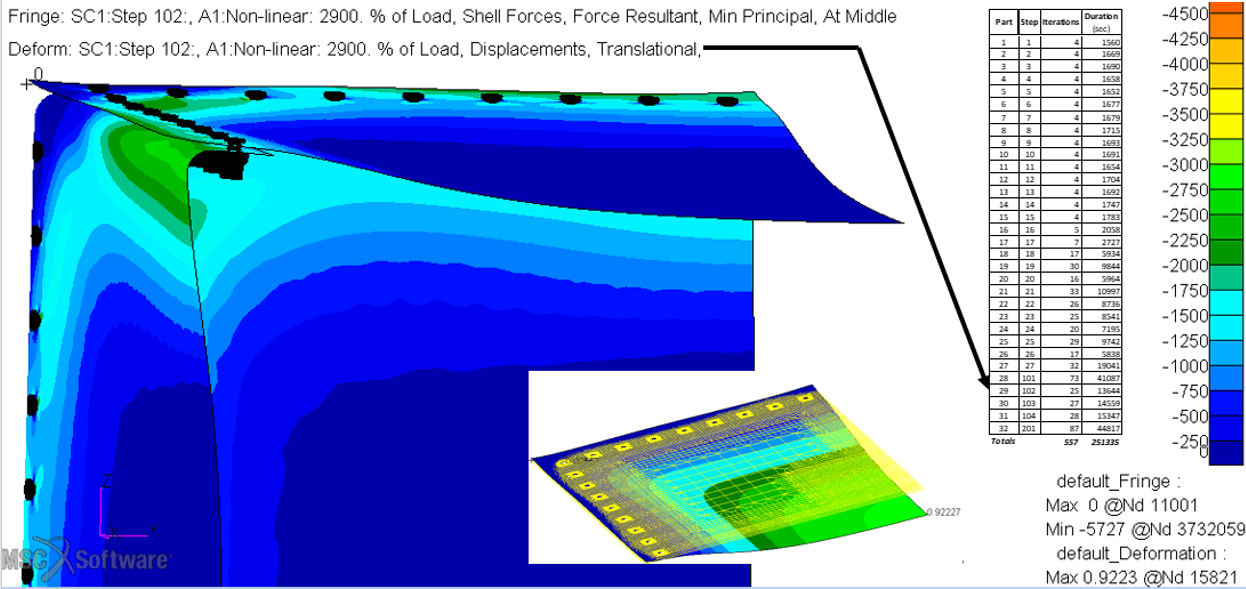
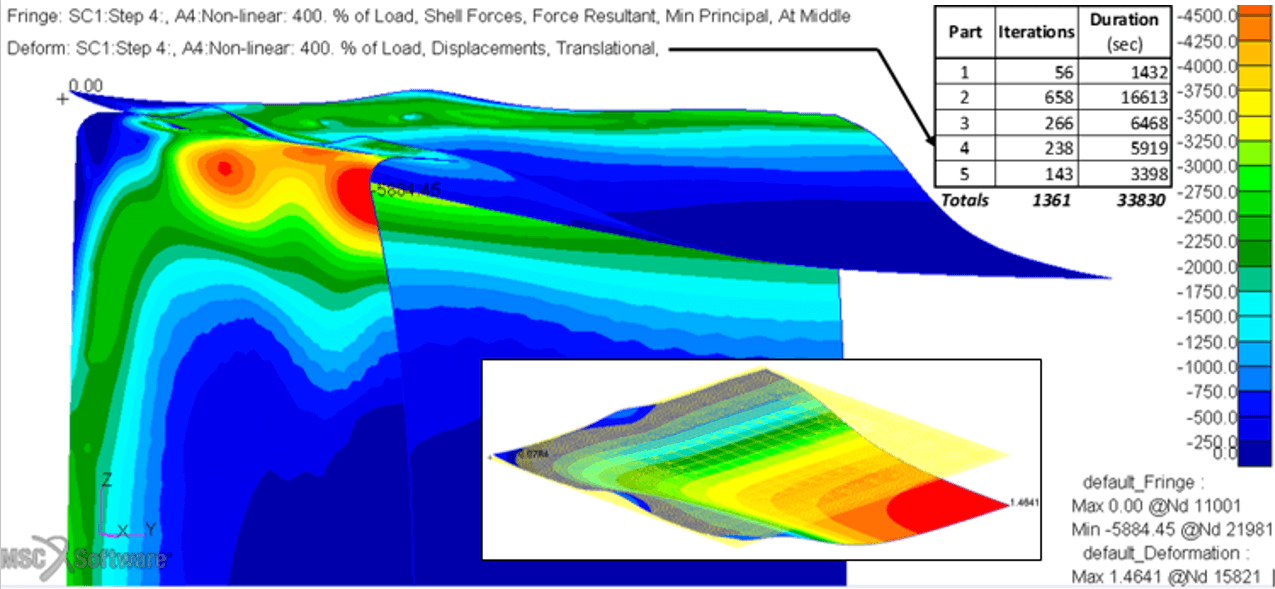
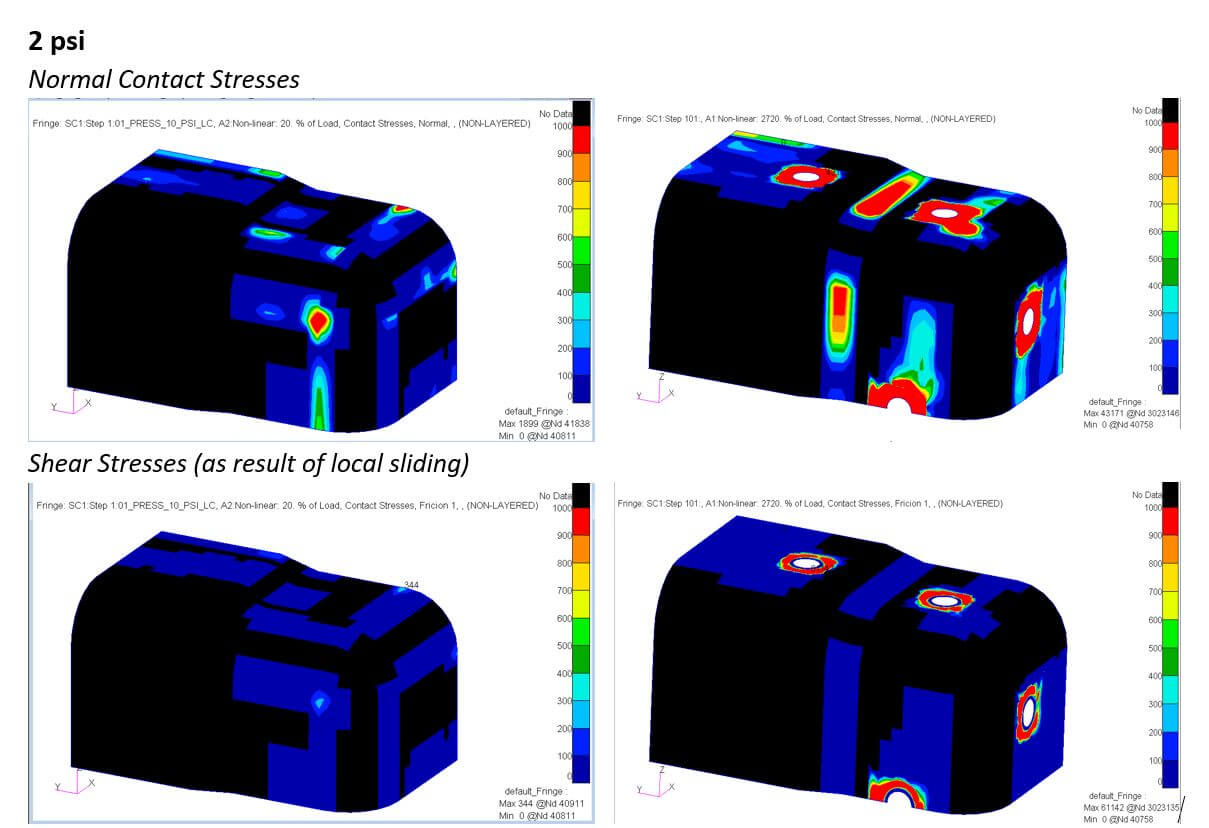
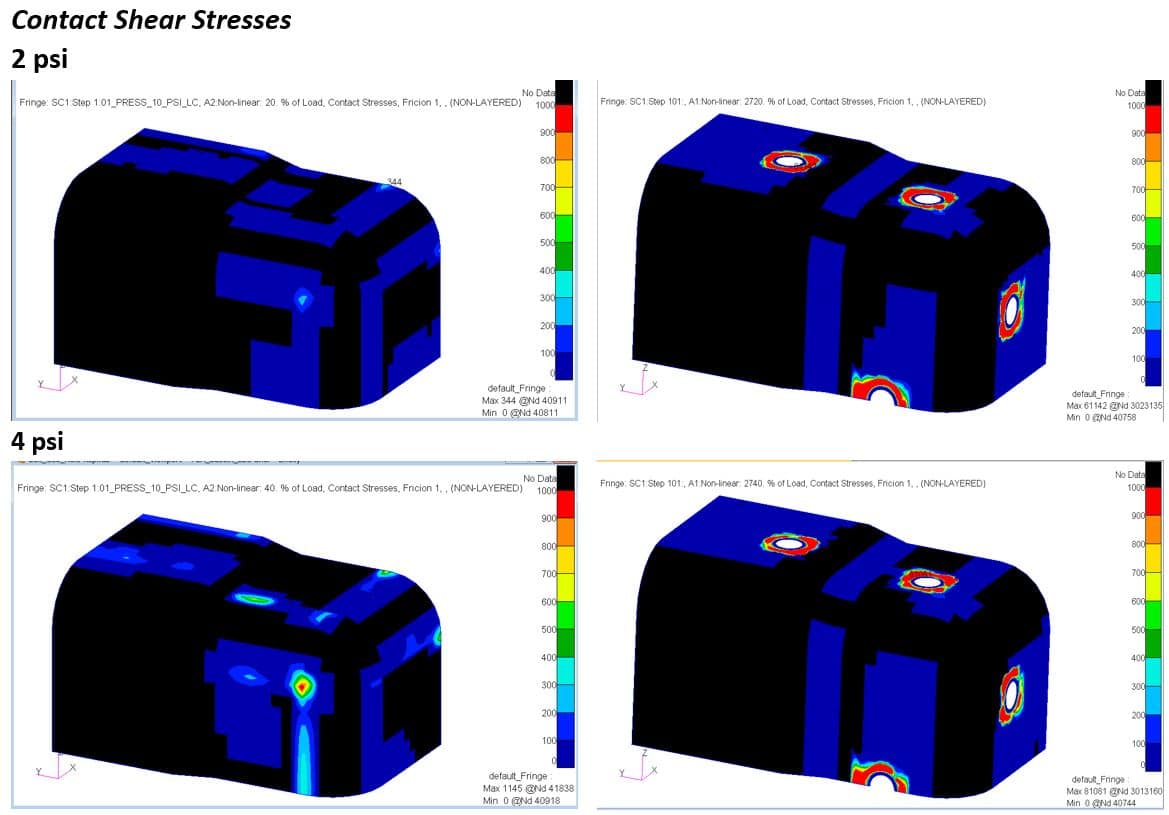
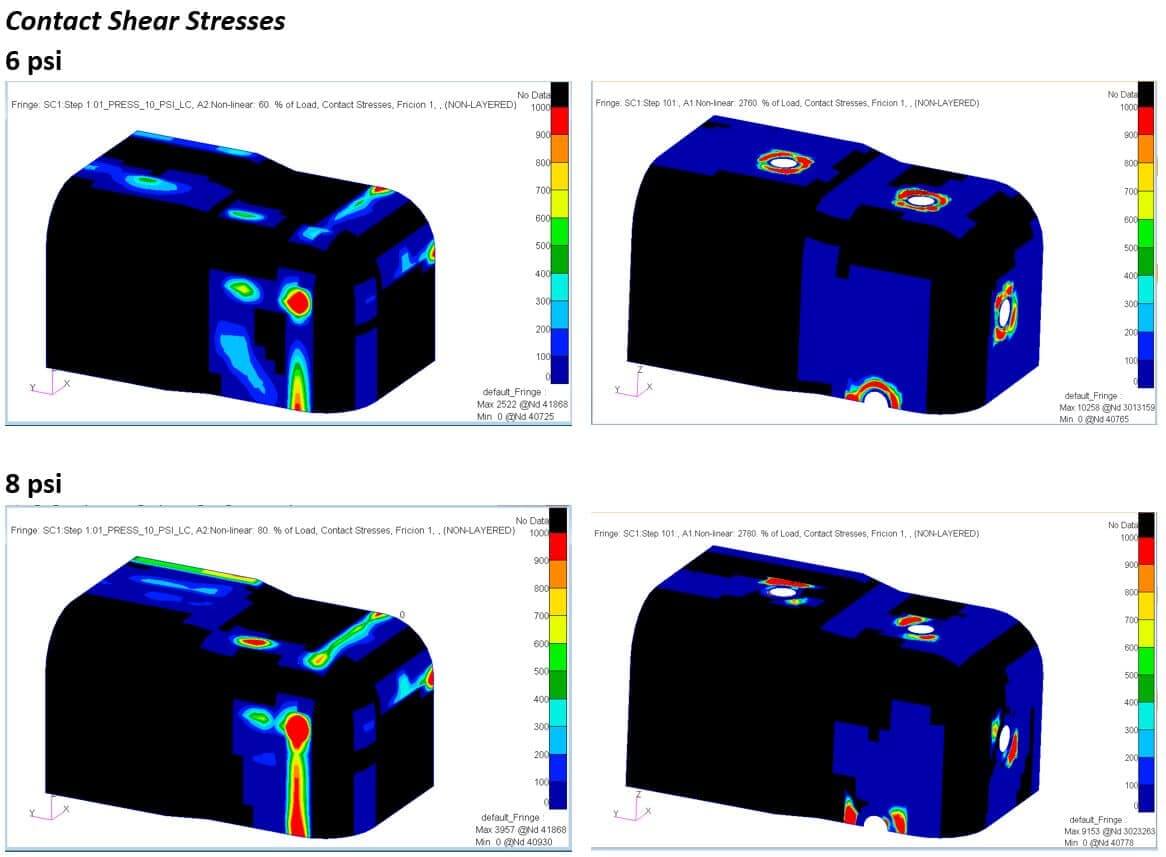
In relation to the normal contact stresses developed at the interfaces between the surfaces, and the shear stresses occurring during the relative sliding at these locations, it is obvious that fastener pretension is a major factor in their magnitude. The two models show that the distribution of these stresses is largely affected, not only immediately underneath the pin heads and the bases of the collars, but also further away, near the flange edges, fillets or corners. In figures 80, 81 and 82, a brief exemplification is shown for the upper corner of the lateral panel, for pressures up to 8psi.
In these figures, black indicates that there is no contact, dark blue represents joining contact and red highlights equal to, or larger than, the upper value of the scale used. For consistency, the same scale is used for both models. In the case of shear stresses, dark blue indicates that there is no sliding, while the other colours indicate the shear stresses that have developed due to friction during sliding.
The evolution of the surface shear stress, due to inter surface sliding from 0 to 25 psi, is included at the end of the video 85.
Videos 83 and 84 present the box configuration, stresses and internal loads in the parts, and the evolution of the contact status for all components, at locations marked: Model 1 (without pretension—12′:39″) and Model 2 (with pretension—20′:40″).