JOINTS AND FASTENER LOADS
The Problems
Threaded fasteners are widely used in mechanical assemblies as the main means of transferring loads between components and to establish the paths of the internal loads for the external or functional conditions of the structure. For thin semi-monocoque structures (like in aircraft, ships and, to a lesser extent, in the automotive applications) decades of service experience have shown that under repeated loading the damage occurs mostly in the joined parts, starting from the fastener holes and not in the fasteners. This is because of the stress concentrations introduced in these parts by the fastener holes and by the fasteners themselves. In carbon fiber reinforce polymers (CFRP) components however the fasteners may fail in fatigue.
In order to streamline the design and sizing of fastened joints researchers and engineers have and continue to address extensively the performance of such joints. The problems with such joints reside in the high number of parameters influencing the joint performance and in the fact that compounded, the effect of these parameters make the relationship between the load transfer at the fasteners and the strength of the joint highly nonlinear.
The parameters affecting the joint strength can be split in two categories:
- Fastener installation parameters (fastener fit, amount of cold working, quality of holes and faying surfaces quality, type of fasteners and clamping/pretension forces);
- Configuration parameters (joint geometry, mode of loading i.e. single or double shear, amount of local load transfer and amount of secondary bending in the fasteners).
Typical laboratory testing of bolted joints involves hundreds of samples with many thousands of cycles before postprocessing and data reductions and the curves produced for design and sizing are applicable to a limited range of similar fasteners, materials, joint geometries and load transfers.
Parameters like friction, pretension, bolt secondary bending and variation in the loads transferred by the fasteners with the increase in the number of loading cycles are seldom explicitly accounted for because of the high cost of these tests and because of physical difficulties in measuring these quantities.
Goals Definition for Today’s Technology
Because of the increase in the last decade in the computing power and the developments in the commercially available finite element analysis (FEA) software it is possible today to replace the large number of laboratory tests with numerical simulations calibrated and validated against the results of a limited number of laboratory tests.
While there is no imaginable shortcut that can be effective in reducing the number of parameters that affect the strength of a bolted joint, calibrated and validated numerical simulations are providing a cheaper and faster alternative to the extensive laboratory testing. They also provide a quantified basis for accounting for the effect of parameters like friction, bolt pretension or secondary bending during design and for in service inspections and repairs.
More importantly, the results may be parametrized for different proportions of multi-axial loads and used for sizing of specific joints.
Brief History of Bolted Joint Analysis and Design
In the design of the bolted joint a very intuitive and natural first step is to establish the fasteners loads. As early as 1946 Tate and Rosenfeld introduced the very rational concept of Bolt Constant which was defined as the linear approximation of the total displacement caused by the fastener deformation, fastener tilt and the deformation of the fastener hole. This concept, familiar to all structural engineers designing bolted joints, is shown in Figure 1.
Semi-empirical bolt constants were determined from tests at many large aircraft organizations. Some of the most popular expressions for the Bolt Constants in the aircraft industry are shown in Figure 2.
The one-dimensional bolt load determination remained the common industry approach for many decades. In its basic format the determination of the fastener loads was as shown in Figure 3.
Today a natural approach when making a 2D or 3D FEA model of a structure with many fasteners would be to connect the nodes at the fastener locations with springs simulating the lateral fastener flexibilities (Fe). At locations with medium and high fastener load transfer the flexibilities of the springs are calibrated against laboratory test articles. For the calibration the type and size of the elements in the model of the test article are similar to the elements used in the model for the main structure.
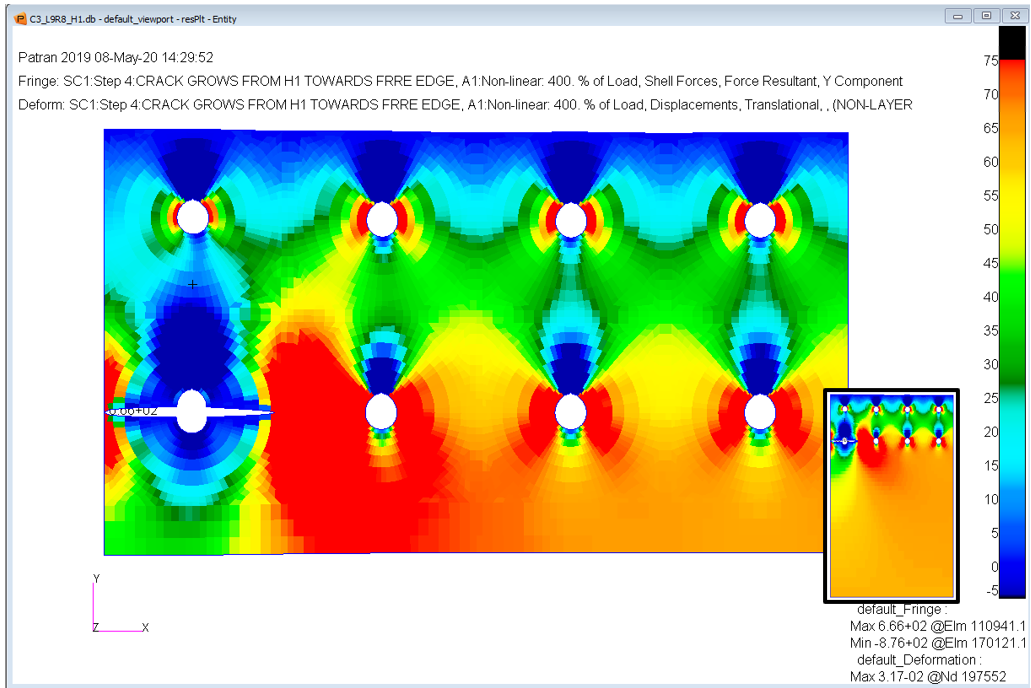
Laboratory tests and analytical studies have shown that for multi-fasteners configurations the internal forces and stresses have a pronounced 3D variation. An example of the internal loads for a simple lap splice loaded in tension is shown in Figures 4. Figure 5 shows the changes for the distribution of the internal forces when a two-sided crack at a hole is present.
A one-dimensional modelling can not capture any of these load distributions in the joined parts.
Progressive damage under normal operational loads occurs always for in-service structures and cracking around the fastener holes is one of the most common form of damage for structures with thin elements.
Why?
Having to face a case of fatigue cracking in service and asking oneself why the cracking occurred where it did and not at the fastener next by, it is often very easy to realize that the amount of local load transfer is the highest, just where the cracking occurred.
Test data has shown that the resistance to cracking at the fastener holes is strongly influenced by the magnitude of the load transferred by the fastener.
Traditionally the load transfer is classified as low, medium or high based on the fraction of the load that is transferred between members at the first row of fasteners Low load transfer is when the fraction is below 10%, medium load transfer is between 10% and 30% and above 30% is considered high load transfer.
Feasibility of Numerical Simulations
Numerical simulations using appropriate mesh sizes for capturing the regions around the fastener holes and the interplay between the fastener shank and the pin of the bolt are currently relatively easy to achieve with common commercial FEA packages having advanced capabilities in simulating contact interactions between the parts.
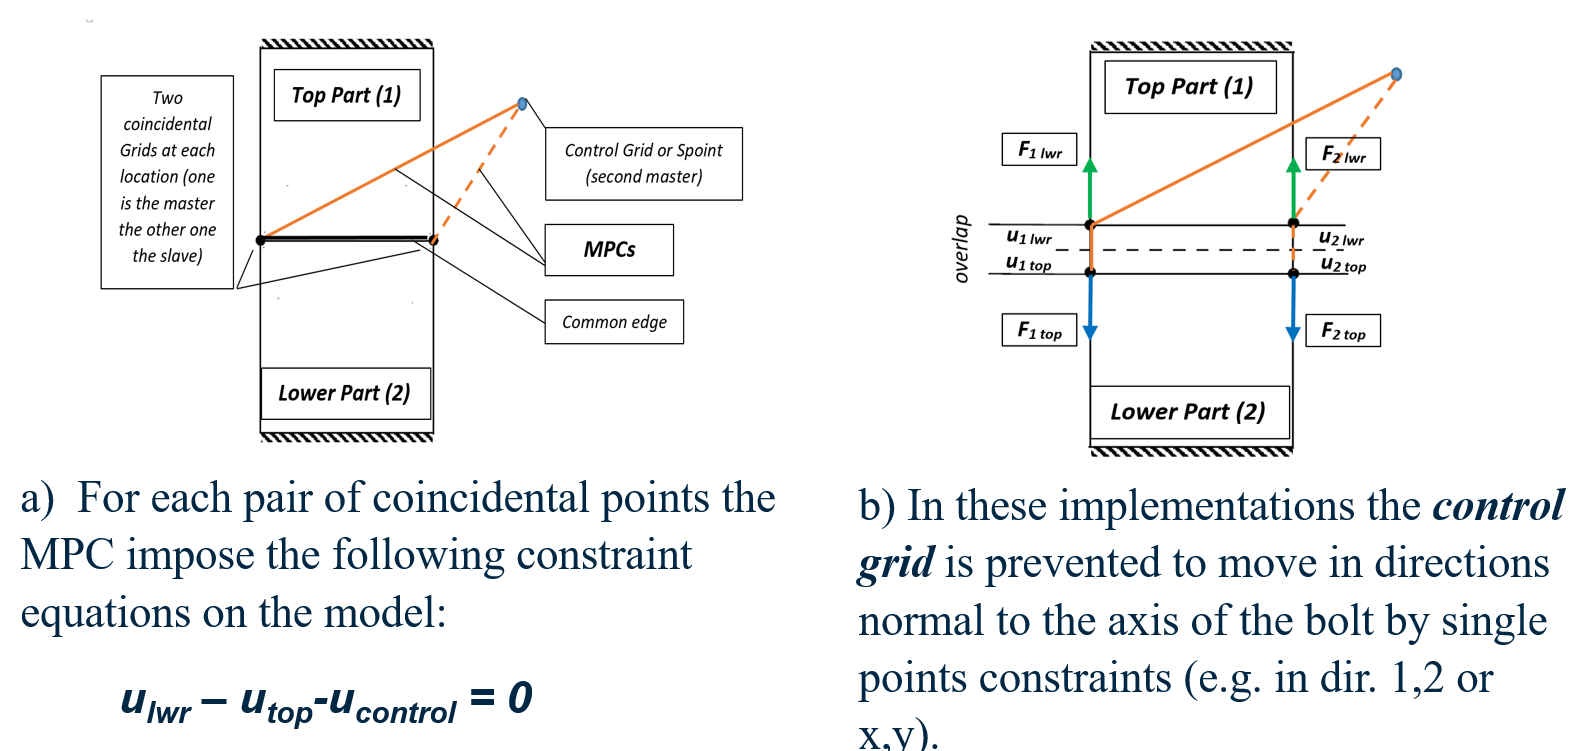
Contemporary finite element packages like Nastran, Marc, Abaqus or Ansys have incorporated dedicated methods and/or elements to enable the modelling and evaluation of the local stress/strain fields at and around the pre-tensioned fasteners. The methods available involve splitting of the fastener shank in two parts and the “shortening” of the shank with a set of unidirectional multipoint constraint (MPC) equations until the desired pretension force is reached. After that the two parts are “locked” with the shortening and the remaining fixed while the other loads are being applied Figure 6. For all subsequent load cases, the control grid/node is fixed in all three directions (1,2,3).
This approach is very effective when the fasteners are subject to separating tensile forces and when the components remain relatively fixed in operation, with no lateral loads requiring the fasteners to sustain shear forces. It is not compatible with large displacements nor with fasteners loaded in shear.
Another fastener modelling technique for NASTRAN, introduced at the MSC 2019 Indo-Pacific User Conference, maintains the continuity of the pin and is compatible with both large parts displacements and with the transfer of shear forces by the fasteners. In this approach, the bolt pin is kept continuous and a separate mesh is used for the nut. After the pretension step, the bolt and the nut are glued together along the common thread area and this condition is kept for all the subsequent loading steps. The initial pretension is introduced in the first step through two RBE3 elements, one acting on the pin shank and the other on the nut.
A short overview of this technique with typical results relevant to pre-tension, bearing loads and to the separation threshold is illustrated in this video clip
Applications for Practical Engineering
Using this approach, a study on the effect of crack length on the fastener loads for a splice joint loaded in tension was conducted for several cracking configurations. All fasteners had high load transfer but no pre-tension. The secondary focus was on the effects of bolt secondary bending and on the typical stresses used in classical linear elastic fracture mechanics (LEFM) analysis. Two of the crack configurations analyzed are shown in Figure 7. Details for configurations analysed are available at https://doi.org/10.4236/msa.2020.117035
This investigation required approximately 150 different runs using SOL 400 in NASTRAN each lasting about 30 minutes and the extraction of several thousands reports with specific results from Patran. Use of *.bat files for batch submission of the jobs to the solver and a relatively large session file for creating Patran data bases from the NASTRAN decks of each run and for the extraction the results in several types of reports enabled the automatization of running and of the initial postprocessing.
A very strict numbering system for the nodes and elements in the model was critical to enabling this automatization.
The next stage of post processing, done in Excel using VBA subroutines was an automated process consisting of tasks occurring behind the scene (I/O operations, checks in the *.f06 and *.ses files and for data reduction in graphical form) and of tasks occurring on the screen with user-friendly forms that enabled verifications, cross-checking and engineering judgment of the results for all stages of post processing and for all crack configurations.
Main results
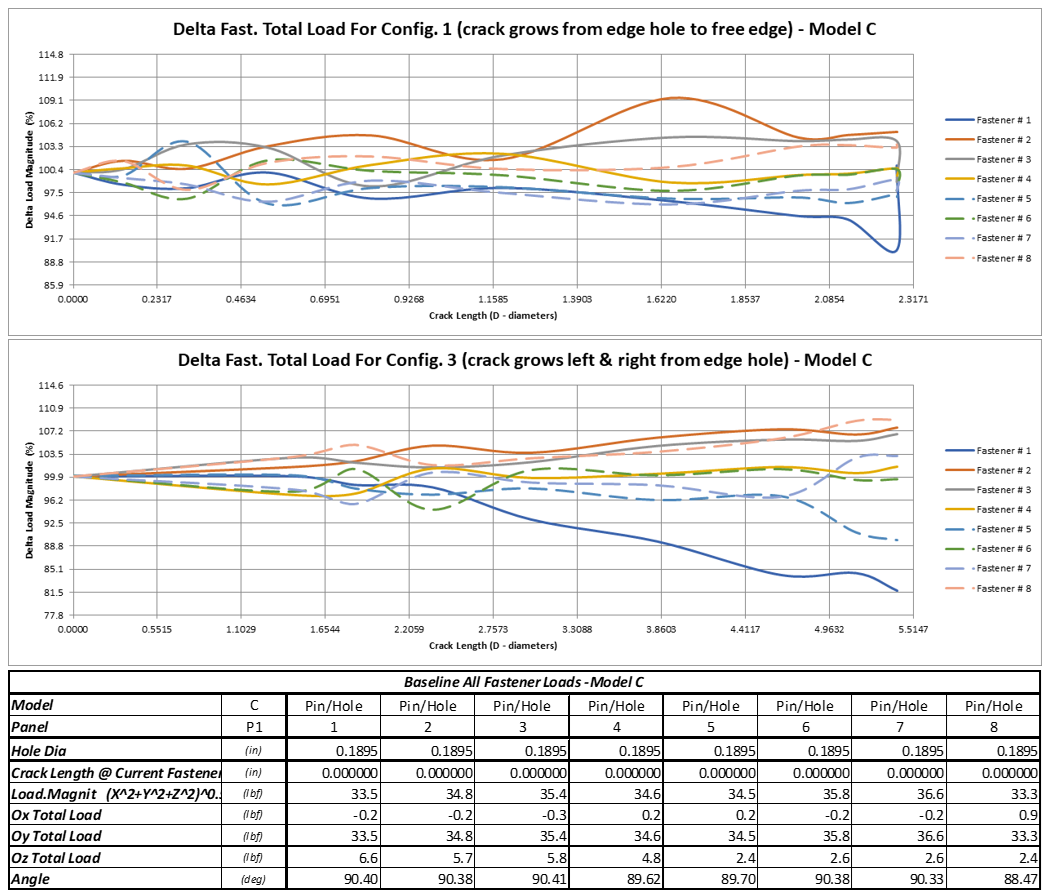
- The results for the fasteners load transfer function show that regardless of cracking configuration, at the cracked hole the load decreases by up to 20% of its value in non-cracked conditions and that, after the ligament fracture, the fastener continues to transfer that load until new cracks develop and grow. It is especially noticeable that after breakage of the free edge ligament, the load at that fastener returns almost to its baseline value (the “hook effect” shown in Figure 8) ;
- The through thickness distribution of the bearing contact forces and bearing stresses at the fastener holes was found to have maximum values at the faying surface. This fact is of practical importance for inaccessible single shear joints and for multi-layered joints with high eccentricities in the load path, where the crack can grow undetected for long durations.
- For the cases investigated the effects of secondary bending were found to be very significant with bending ratio σbend/ σtens of 2.5 at a distance of two-hole diameters ahead the first row of holes. This fact is significative when, for real structures, the far field and bypass stresses are established from strain gauge measurements because at the holes the plates are clamped between the fastener head and the nut or collar and at that very location there are no stresses induced by secondary bending. The graphical representation of these variations in the surface stresses is shown in Figure 9 and Figure 10.
Work in progress
The same fastener modelling technique is being used in current work aimed at augmenting the through thickness-stresses generated during bolt pretension to the 2D stresses form SOL101 in order to predict the appearance of eye-brow cracking. A brief of the method used was presented at the 2020 MSC Indo-Pacific Users Conference.
Eye brow cracks are Mode III cracks that initiate and grow near the edges of the fastener heads and they are always remote from the stress concertation at the hole edges. Most eye-brow cracks develop around the fastener’s protruding head and once the surface is cracked, corrosion, service stresses and the wedging of the tilted fastener head accelerate the crack growth. An example of eye-brow cracking is shown in Figure 11.
Urangan Qld 4566


